Crash reports & core dumps
Comprehensive description of Spotflow crash reports and core dumps including technical details.
This page walks you through all the aspects related to Spotflow crash reports, from integrating it into devices, through understanding the transport protocol, to analyzing and troubleshooting crash reports in the web application.
Getting Started with Device Integration
Guide: Crash Reports with Zephyr or Nordic nRF Connect SDK
Spotflow offers native integration for devices running Zephyr and Nordic nRF Connect SDK through a lightweight software module. This module integrates seamlessly with your existing core dump infrastructure - simply add it as a dependency and let Zephyr create the core dump and call Spotflow's fatal error handler.
Guide: Crash Reports with ESP-IDF
Spotflow offers native integration for devices running ESP-IDF through a lightweight software module. The module uses ESP-IDF's built-in core dump functionality, stores crash data in a flash partition, and uploads it after reboot.
Guide: Crash Reports with MQTT
For devices running other platforms or when you cannot use Spotflow device module, integration is also possible via standard MQTT interface. Spotflow platform exposes scalable MQTT broker accessible anywhere from the Internet that can be used to ingest core dumps. See Transport Protocol section for details.
Analyze Crash Reports in the Web Application
Once your device is integrated, you can analyze crash reports and core dumps in the web application.
You can list the crash reports in the Events page, which gives you a comprehensive view of all events collected from your devices. There, you can filter crash reports by their content, device ID and other metadata.
Automatic Analysis
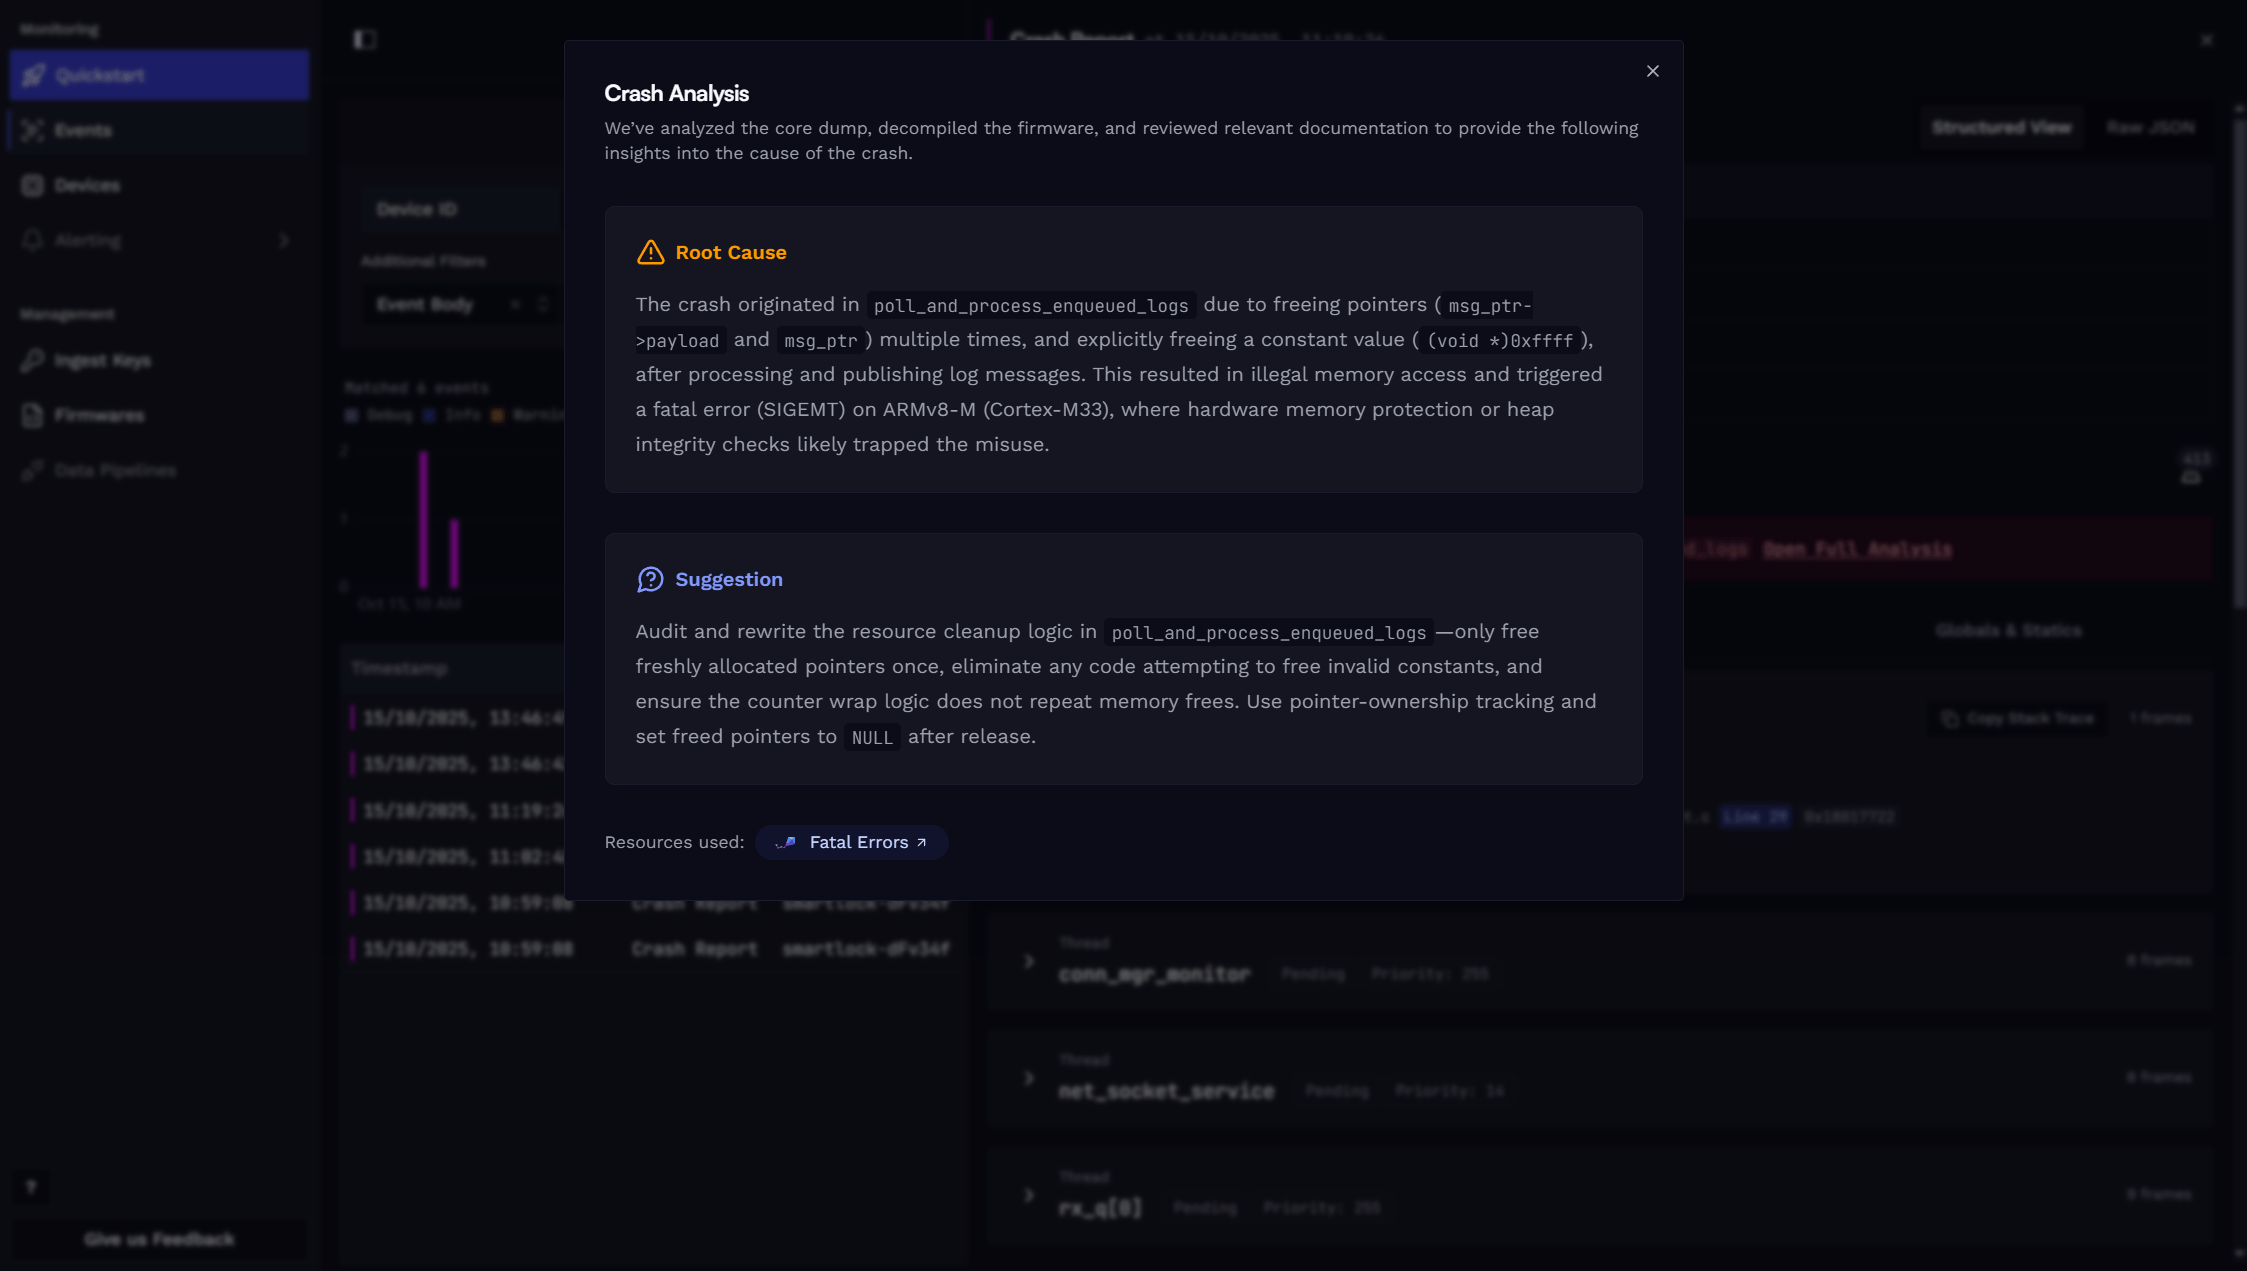
We automatically analyse each crash report to give you a quick insight into the issue. For precise results, we extract data directly from the core dump (stack traces, register values, etc.), decompile the firmware binary, and review relevant documentation. Our proprietary AI agent then investigates the crash, leveraging all available data. The result is available in the detail view of each crash report.

The full analysis includes a detailed description of the root cause and suggestions for fixing the issue. Also, for complete transparency, we include references to all documentation pages used, allowing you to explore further.
We also provide all the raw data extracted from the core dump, so you can dive deeper into the issue if needed. This includes:
- Stack traces of one or more threads.
- Register values and local variables for individual stack frames. If a register value is available, it can be also casted to several types.
- State of global variables at the time of the crash.
Transport Protocol
Spotflow uses an optimized transport protocol based on TCP, MQTT and TLS and two serialization formats (CBOR and JSON).
MQTT over TLS
All log transmission uses MQTT over TLS (MQTTS) for secure, reliable communication:
- TLS Version: 1.2 or higher
- Certificate: Let's Encrypt ISRG Root X1 (pre-installed on many systems or included in Spotflow SDKs)
- Authentication: Devices authenticate using ingest keys as MQTT passwords and their unique device IDs as MQTT usernames.
Serialization format
Core dump is a binary file which exact format of the core dump depends on the operating system, hardware and toolchain used to generate it.
Some operating systems define their own custom core dump format (e.g. Zephyr RTOS) while others are
building on top of the well-known formats, mainly ELF, by setting ET_CORE ELF file identifiers and adding one or more ELF sections
(e.g. Linux, NetBSD).
Spotflow is agnostic to the exact core dump format and provides basic support for core dumps in any format. However, there is advanced support for some formats, including Zephyr RTOS and ESP-IDF. For the specifically supported formats, various information such as stack traces, register values etc are extracted from the core dumps and further analysed.
No matter the format, the core dumps are always sent in one or more chunks via MQTT messages with CBOR or JSON formatted content:
- CBOR-based: recommended for memory and bandwidth efficiency. Used by Spotflow Zephyr and ESP-IDF modules.
- JSON-based: recommended for simplicity and interoperability, especially for custom integrations over MQTT.
When building a custom MQTT integration, JSON core dump chunk payloads can be used even if your device-side SDK uses CBOR by default.
Publish core dump chunk messages to the ingest-json topic using the following JSON schema:
{
  // Must be set to CORE_DUMP_CHUNK.
  "messageType": "CORE_DUMP_CHUNK",

  // Identifier of the core dump unique within a scope of device and last 7-days.
  "coreDumpId": 123,

  // Zero-based index of the chunk in the sequence.
  "chunkOrdinal": 1,

  // Base64-encoded chunk data.
  "content": "WkUCAAMABQADAAAAQQIARAADAAAAAAAAAElTKgAAAAAAuMIFE...",

  // (Optional) Flag indicating if this is the last chunk.
  "isLastChunk": false,

  // (Optional) Identifier of the ELF file build for linking with symbols.
  "buildId": "build-123",

  // (Optional) Operating system indicator, currently only "Zephyr" or empty one is supported.
  "os": "Zephyr",

  // (Optional) source device ID for gateway/relay architectures — see Source Device ID
  // Can be a string (single hop) or an array of strings (multi-hop)
  "sourceDeviceId": "sensor-01"
}
Publish core dump chunk messages to the ingest-cbor topic using the following CDDL schema:
core-dump-chunk = {
    0 => 2,        ; messageType: must be set to 2 = "CORE_DUMP_CHUNK".
    9 => uint,     ; coreDumpId: identifier of the core dump unique within a scope of device and last 7-days.
    10 => uint,    ; chunkOrdinal: zero-based index of the chunk in the sequence.
    11 => bstr,    ; content: chunk data.
    ? 12 => bool,  ; isLastChunk (optional): flag indicating if this is the last chunk.
    ? 14 => tstr,  ; buildId (optional): identifier of the ELF file build for linking with symbols.
    ? 15 => tstr,  ; os (optional): operating system indicator, currently only "Zephyr" or empty one is supported.
    ? 31 => (tstr / [+ tstr])  ; sourceDeviceId (optional): source device for gateway/relay architectures
}
Build IDs
Depending on the core dump format, some information (such as register names and values) can be obtained directly from the core dump files without any other context. However, to decode information such as stack traces, local variables names and values, global variables names and values, the core dump needs to be linked with the exact version of an executable binary that produced the core dump (more precisely, to the debugging symbols for that binary). Sometimes, These debugging symbols are part of the executable binary itself (e.g. the ELF files support this) and sometimes they are stored in separate symbol files.
To facilitate this linking, the concept of Build ID is widely used. This ID represents a specific version of the executable binary and associated debugging symbols. When the build ID is included in the core dump metadata and there is a repository repository of debugging symbols available, these two can be automatically linked together. See Firmware Management for details about managing debugging symbols in Spotflow.
From the implementation point of view, the build ID is generated by hashing relevant parts of the executable binary (e.g. ELF sections that influence the runtime behavior such as code or global data, excluding sections like debugging symbols)
Spotflow is agnostic to the exact build ID generation algorithm as long as it is deterministic and consistent. When using Spotflow Device Module for Zephyr RTOS, the build ID is automatically generated (using algorithm similar to GNU Build ID) and embedded into the ELF file during build. When using Spotflow Device Module for ESP-IDF, the build ID is derived from ESP-IDF's application ELF SHA-256 value.
Device ID
Ideally, each physical device should use its own unique device ID for core dump chunks ingestion (possibly even its own Ingest Key). However, we know that mistakes in device provisioning and configuration can happen so our transmission protocol is robust to multiple devices using the same device ID at the same time. In such cases, the devices will still to send core dump chunks to Spotflow without disruption, given that they use unique core dump IDs.
At least once delivery
Once a core dump chunk message is ingested by our MQTT broker, we guarantee that the message will be processed and made available for querying. No data loss is tolerated after acceptance. However, depending on the MQTT QoS level used for publishing, some messages might get lost before they are ingested by the broker.
Learn more
Fundamentals: Metrics
Fundamentals: Logging
Fundamentals: Firmware management
How is this guide?