Crash reports with MQTT
Send crash reports and collect core dumps from any device in the field that can run a MQTT client and analyze them with Spotflow.
This guide explains how to send crash reports and core dumps from devices running running a MQTT client and analyze crashes and core dumps in the Spotflow web application.
Connect to the Spotflow MQTT broker
As the very first step, check the following basic integration guides:
Publish core dump in JSON or CBOR format
Core dump first needs to be split into chunks (of up to 900 KiB each) and then each chunk can be sent as a separate MQTT message. Order in which the messages are sent is not critical as long as all chunks have proper ordinal and the last chunk is marked accordingly.
All chunks belonging must have the same core dump ID set which is a non-negative integer with range between 0 and 2^63-1 (LONG_LONG_MAX).
This ID needs to be unique in the scope of a one device (device ID) and last 7 days, not globally.
This implies that senders/devices can generate random integers in a stateless manner for this purposes.
To enable automatic core dump analysis, specify the operating system in the core dump chunk.
The build ID can be sent either in the core dump chunk or earlier in Session Metadata for the same direct MQTT connection. If both are provided, the chunk-level build ID is used. For gateway or relay scenarios, include the build ID in the core dump chunk for the source device.
To send core dump chunks in JSON, simply publish MQTT messages into the ingest-json topic.
The messages should follow the schema below:
{
  // Must be set to CORE_DUMP_CHUNK.
  "messageType": "CORE_DUMP_CHUNK",

  // Identifier of the core dump unique within a scope of device and last 7-days.
  "coreDumpId": 123,

  // Zero-based index of the chunk in the sequence.
  "chunkOrdinal": 1,

  // Base64-encoded chunk data.
  "content": "WkUCAAMABQADAAAAQQIARAADAAAAAAAAAElTKgAAAAAAuMIFE...",

  // (Optional) Flag indicating if this is the last chunk.
  "isLastChunk": false,

  // (Optional) Identifier of the ELF file build for linking with symbols.
  "buildId": "build-123",

  // (Optional) Operating system indicator, currently only "Zephyr" or empty one is supported.
  "os": "Zephyr",

  // (Optional) source device ID for gateway/relay architectures — see Source Device ID
  // Can be a string (single hop) or an array of strings (multi-hop)
  "sourceDeviceId": "sensor-01"
}
Tip for Testing: use a command-line MQTT client to test messages without writing code.
Note, that the publish command within these CLI clients typically handles the entire sequence for you: it connects, sends the message, and disconnects.
See examples in Quickstart.
To send core dump chunks serialized in CBOR, simply publish MQTT messages into the ingest-cbor topic.
The payload should include a chunk following the core-dump-chunk schema as defined below:
core-dump-chunk = {
    0 => 2,        ; messageType: must be set to 2 = "CORE_DUMP_CHUNK".
    9 => uint,     ; coreDumpId: identifier of the core dump unique within a scope of device and last 7-days.
    10 => uint,    ; chunkOrdinal: zero-based index of the chunk in the sequence.
    11 => bstr,    ; content: chunk data.
    ? 12 => bool,  ; isLastChunk (optional): flag indicating if this is the last chunk.
    ? 14 => tstr,  ; buildId (optional): identifier of the ELF file build for linking with symbols.
    ? 15 => tstr,  ; os (optional): operating system indicator, currently only "Zephyr" or empty one is supported.
    ? 31 => (tstr / [+ tstr])  ; sourceDeviceId (optional): source device for gateway/relay architectures
}
Analyze Crash Reports in the Web Application
Once your device is integrated, you can analyze crash reports and core dumps in the web application.
You can list the crash reports in the Events page, which gives you a comprehensive view of all events collected from your devices. There, you can filter crash reports by their content, device ID and other metadata.
Automatic Analysis
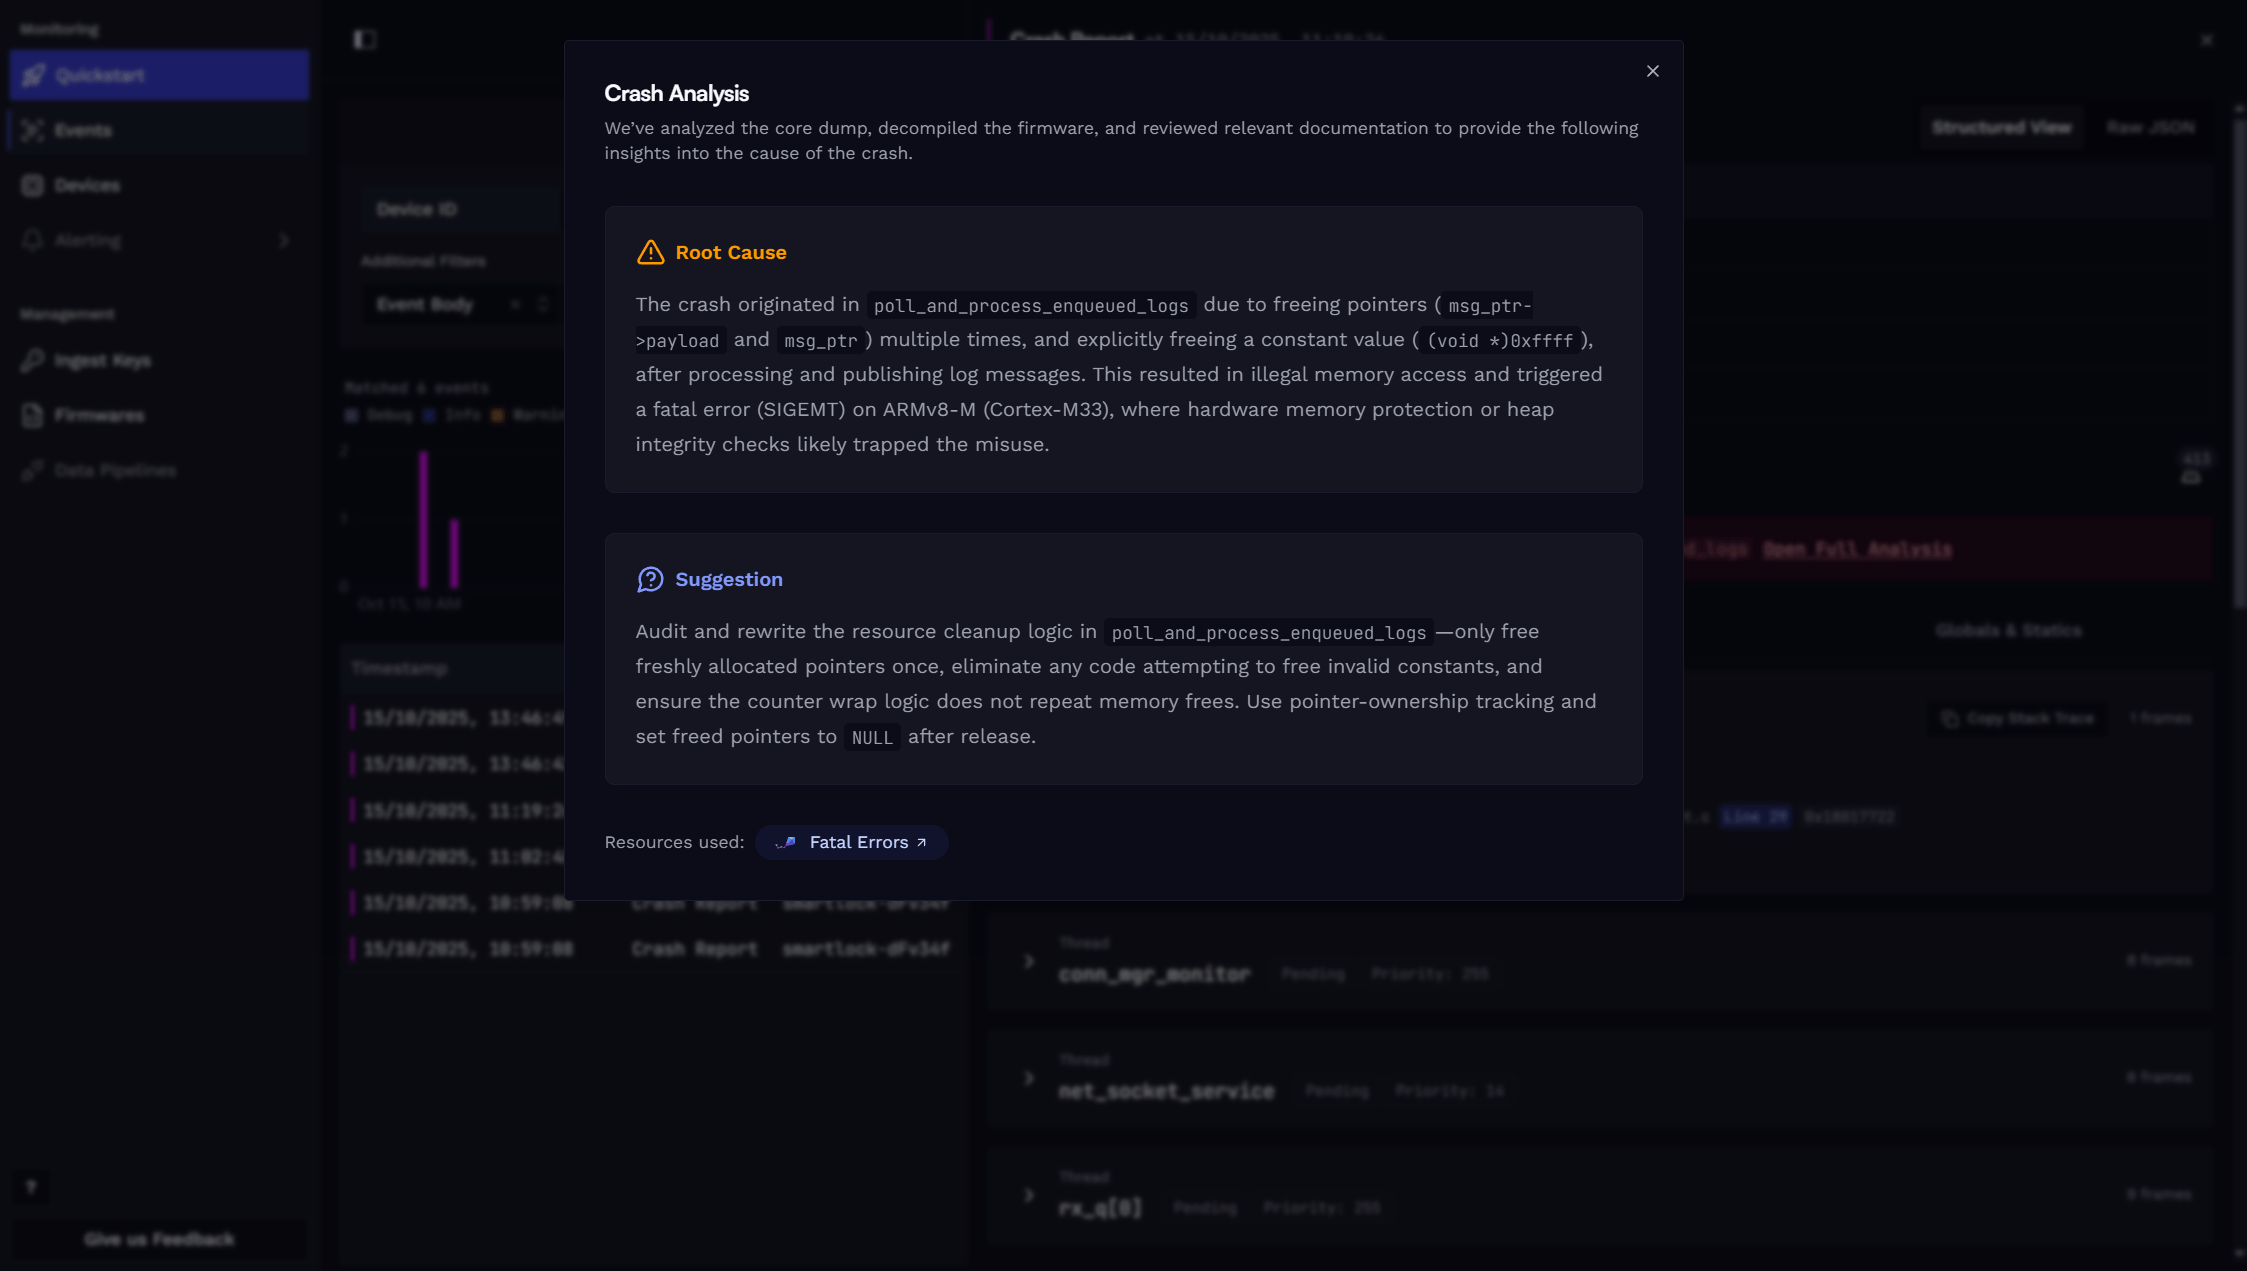
We automatically analyse each crash report to give you a quick insight into the issue. For precise results, we extract data directly from the core dump (stack traces, register values, etc.), decompile the firmware binary, and review relevant documentation. Our proprietary AI agent then investigates the crash, leveraging all available data. The result is available in the detail view of each crash report.

The full analysis includes a detailed description of the root cause and suggestions for fixing the issue. Also, for complete transparency, we include references to all documentation pages used, allowing you to explore further.
We also provide all the raw data extracted from the core dump, so you can dive deeper into the issue if needed. This includes:
- Stack traces of one or more threads.
- Register values and local variables for individual stack frames. If a register value is available, it can be also casted to several types.
- State of global variables at the time of the crash.
Learn more
Fundamentals: Crash reports & core dumps
Guide: MQTT Session metadata
Guide: Logging with MQTT
How is this guide?