Get Started
Welcome to Get Started tutorial for Spotflow IoT platform! In this guide, you'll learn how to connect your device, send data to the platform, and visualize that data in meaningful ways. This is the most common scenario for using the Platform, and this guide is the perfect way to start.
By the end of this tutorial, you will have learned how to:
- Connect a Device: Set up your IoT device and establish a secure connection to the Platform.
- Send Data to the Platform: Make your device collect and send data seamlessly.
- Visualize Data: Use the integrated instance of Grafana to see and understand the data from your device.

If your Sign Up to the Platform, you are just a few clicks away from achieving all above mentioned. The step-by-step guide below will walk you through each process with easy-to-follow instructions and helpful tips. Let's get started and unlock the potential of IoT together!
1. Prepare Workspace
- Python
- C
- Rust
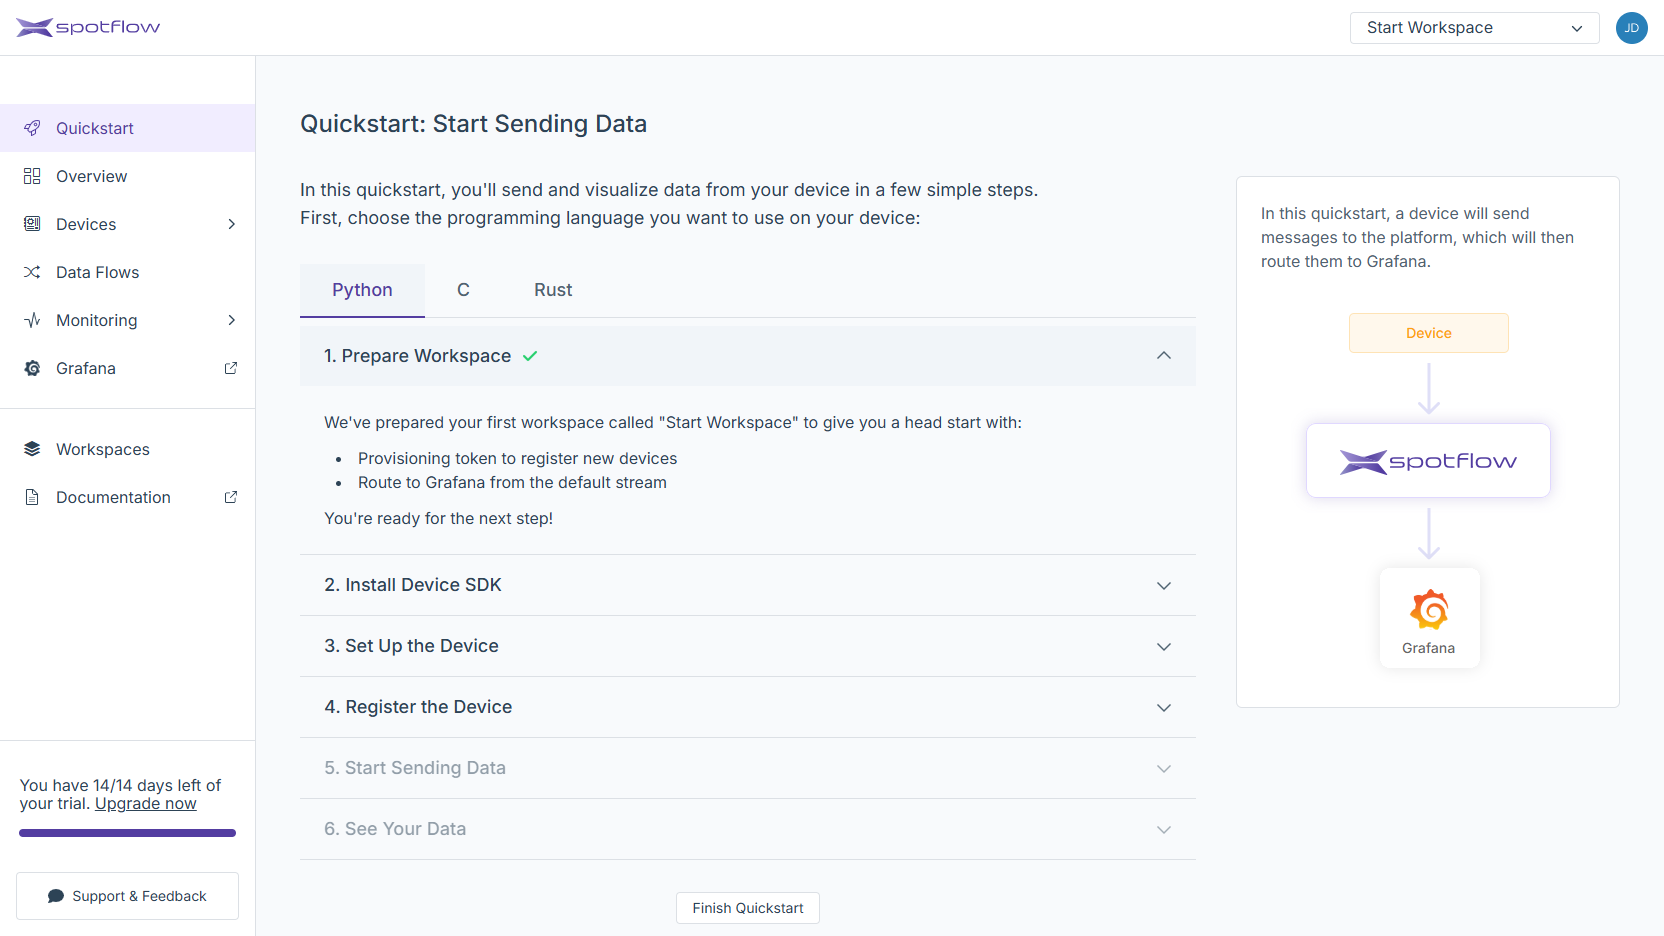

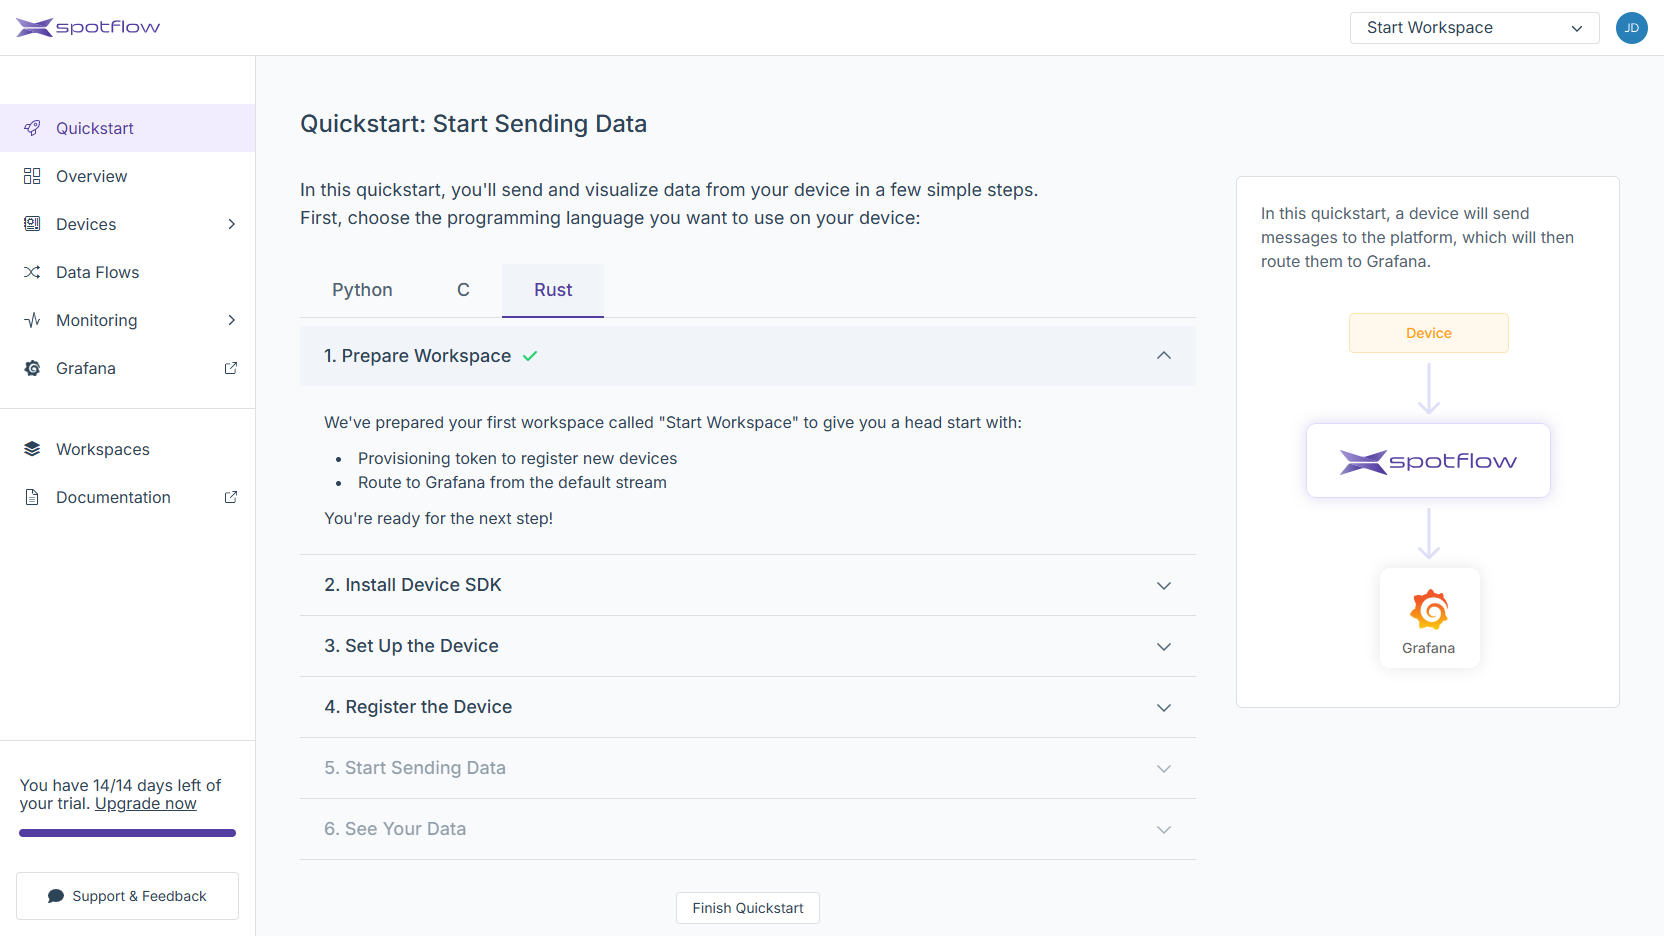
To let you start easy, we:
- Created the Workspace
Start Workspace, it serves as a container for your assets in the Platform. - Created the Stream
default-stream(located in the Stream Groupdefault-stream-group), it acts as a pipe that logically groups related Messages from one or more Devices. - Configured the Stream
default-streamto immediately forward the received Messages to the integrated instance of Grafana. - Created a Provisioning Token, a secret necessary for Device registration.
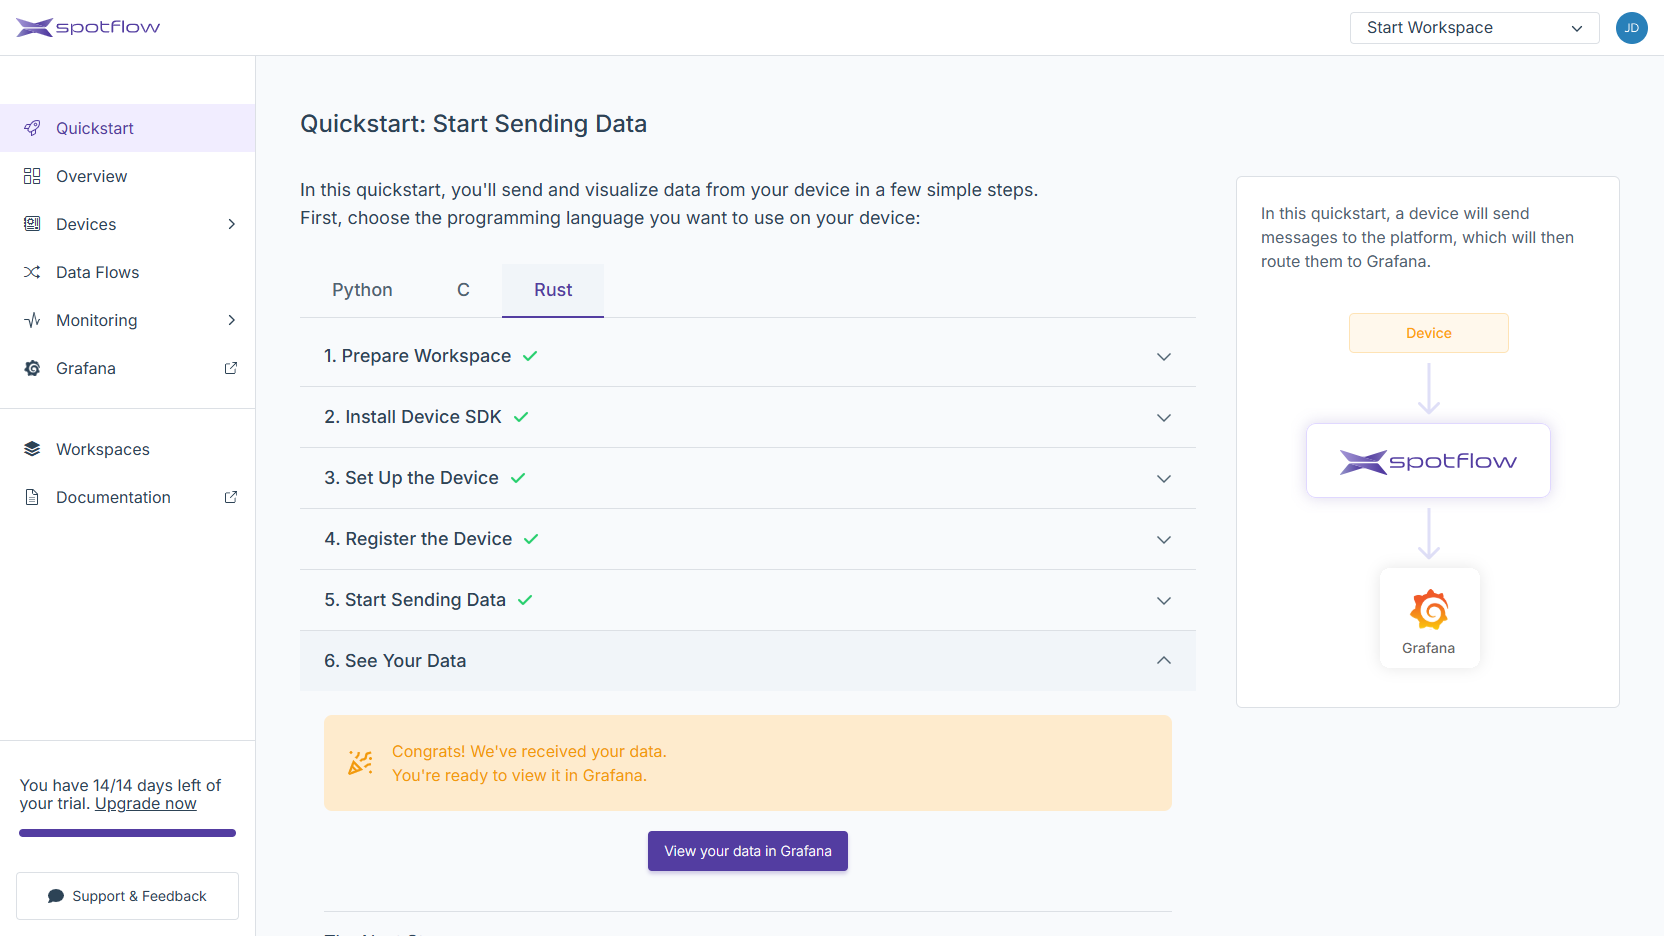
2. Install Device SDK
- Python
- C
- Rust
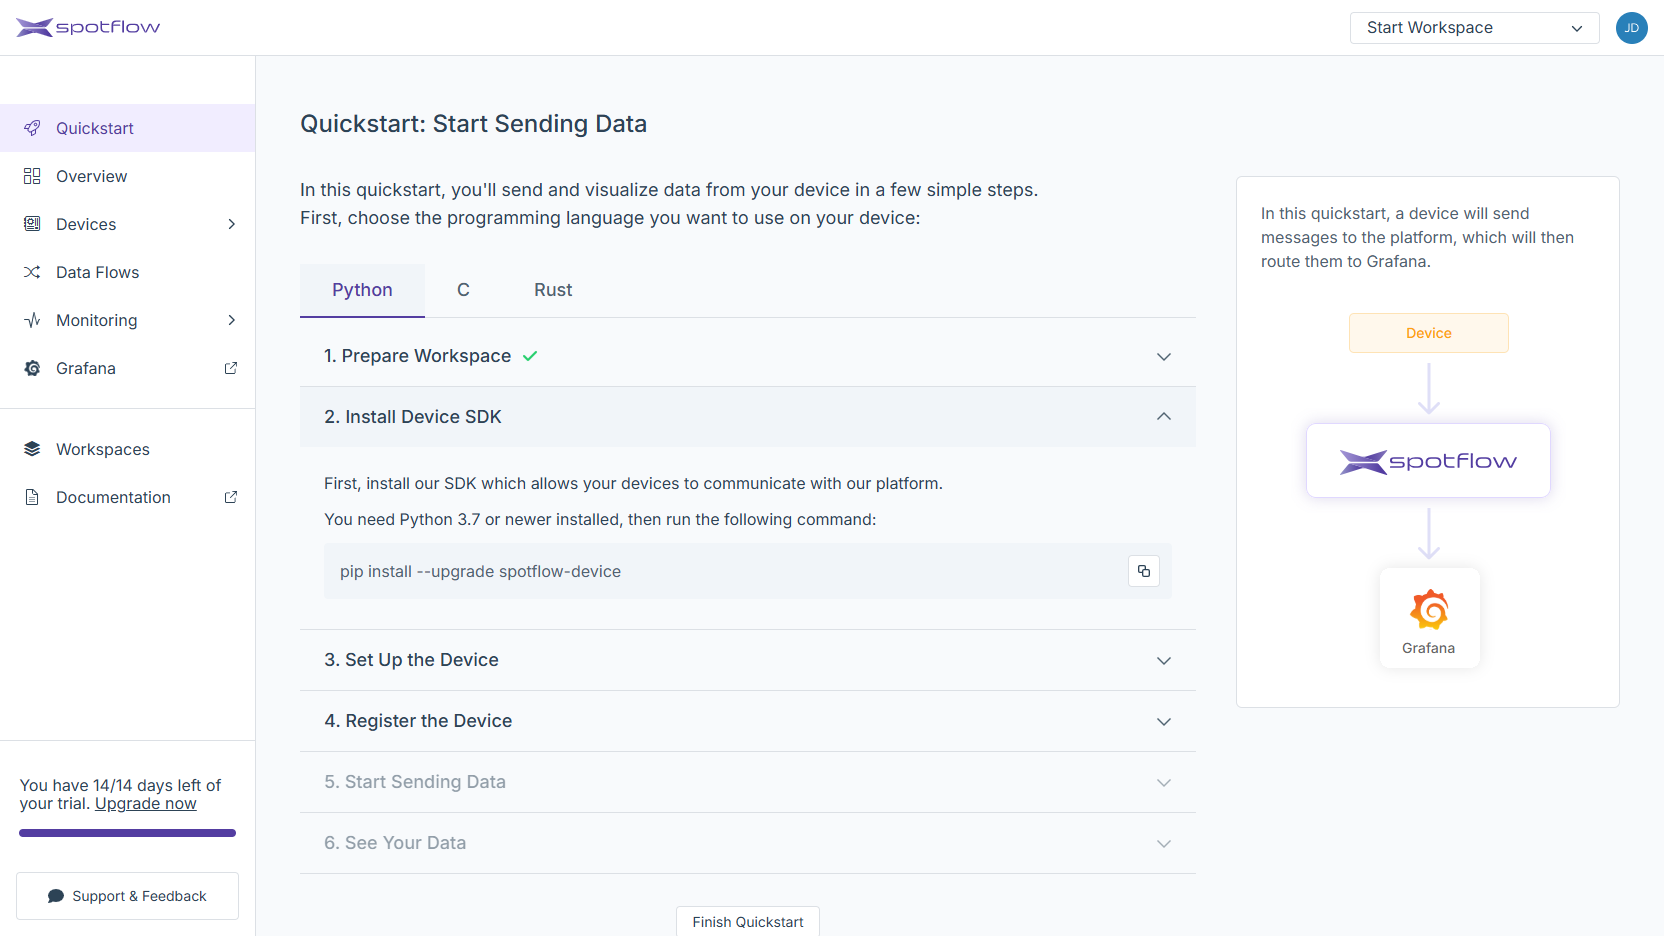
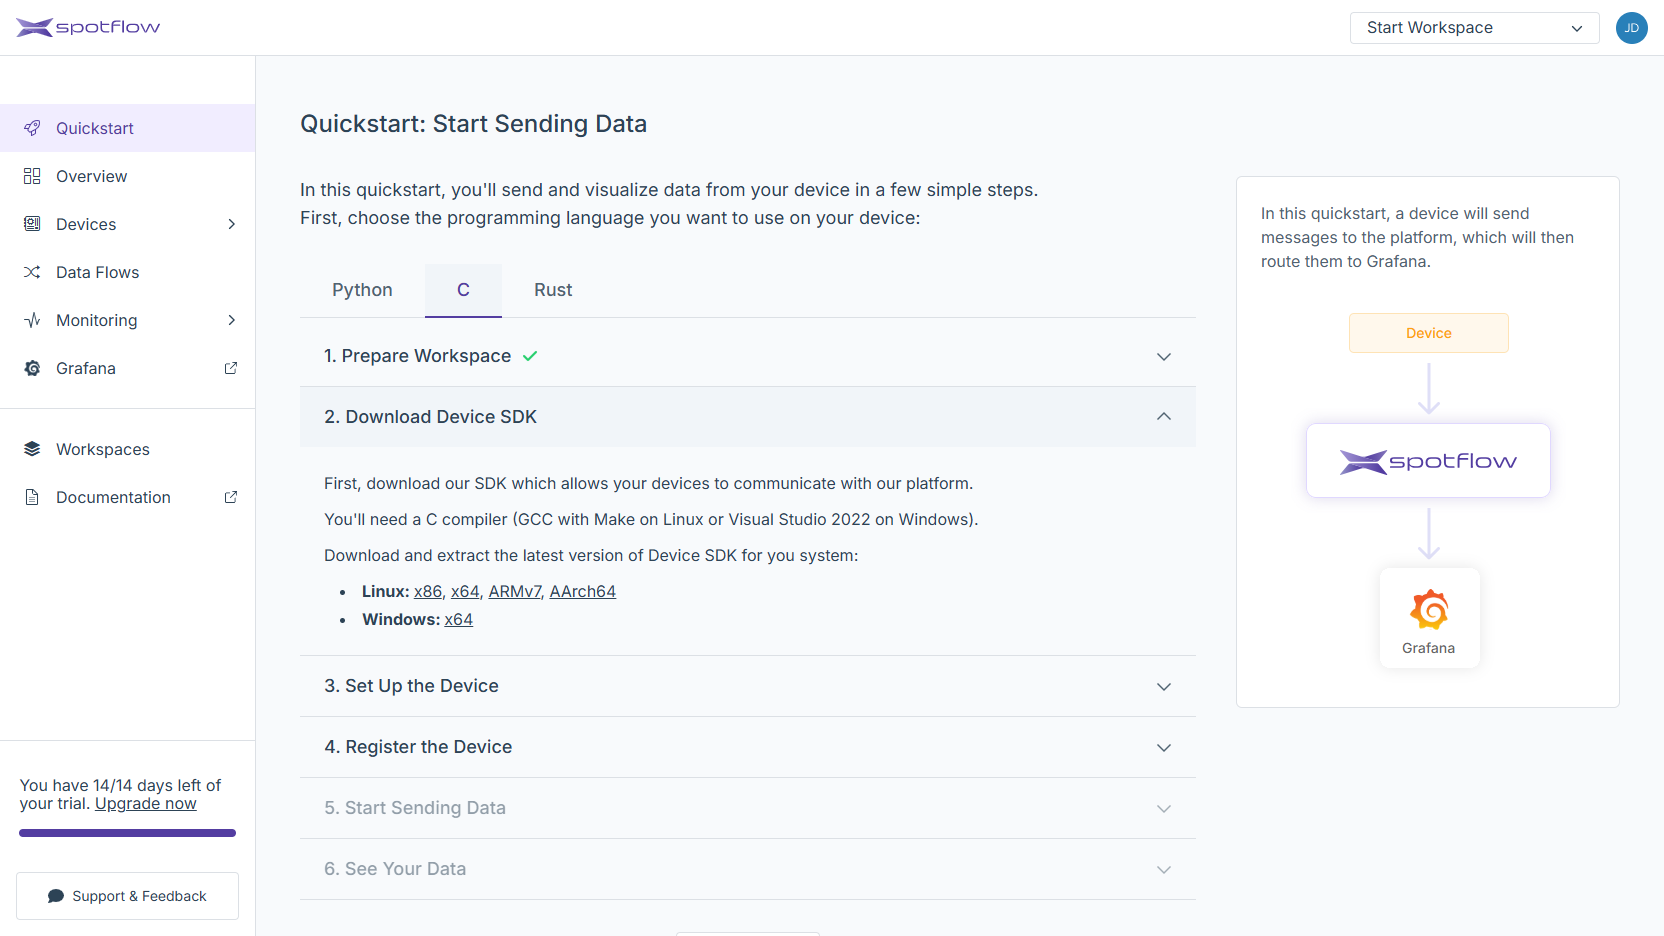
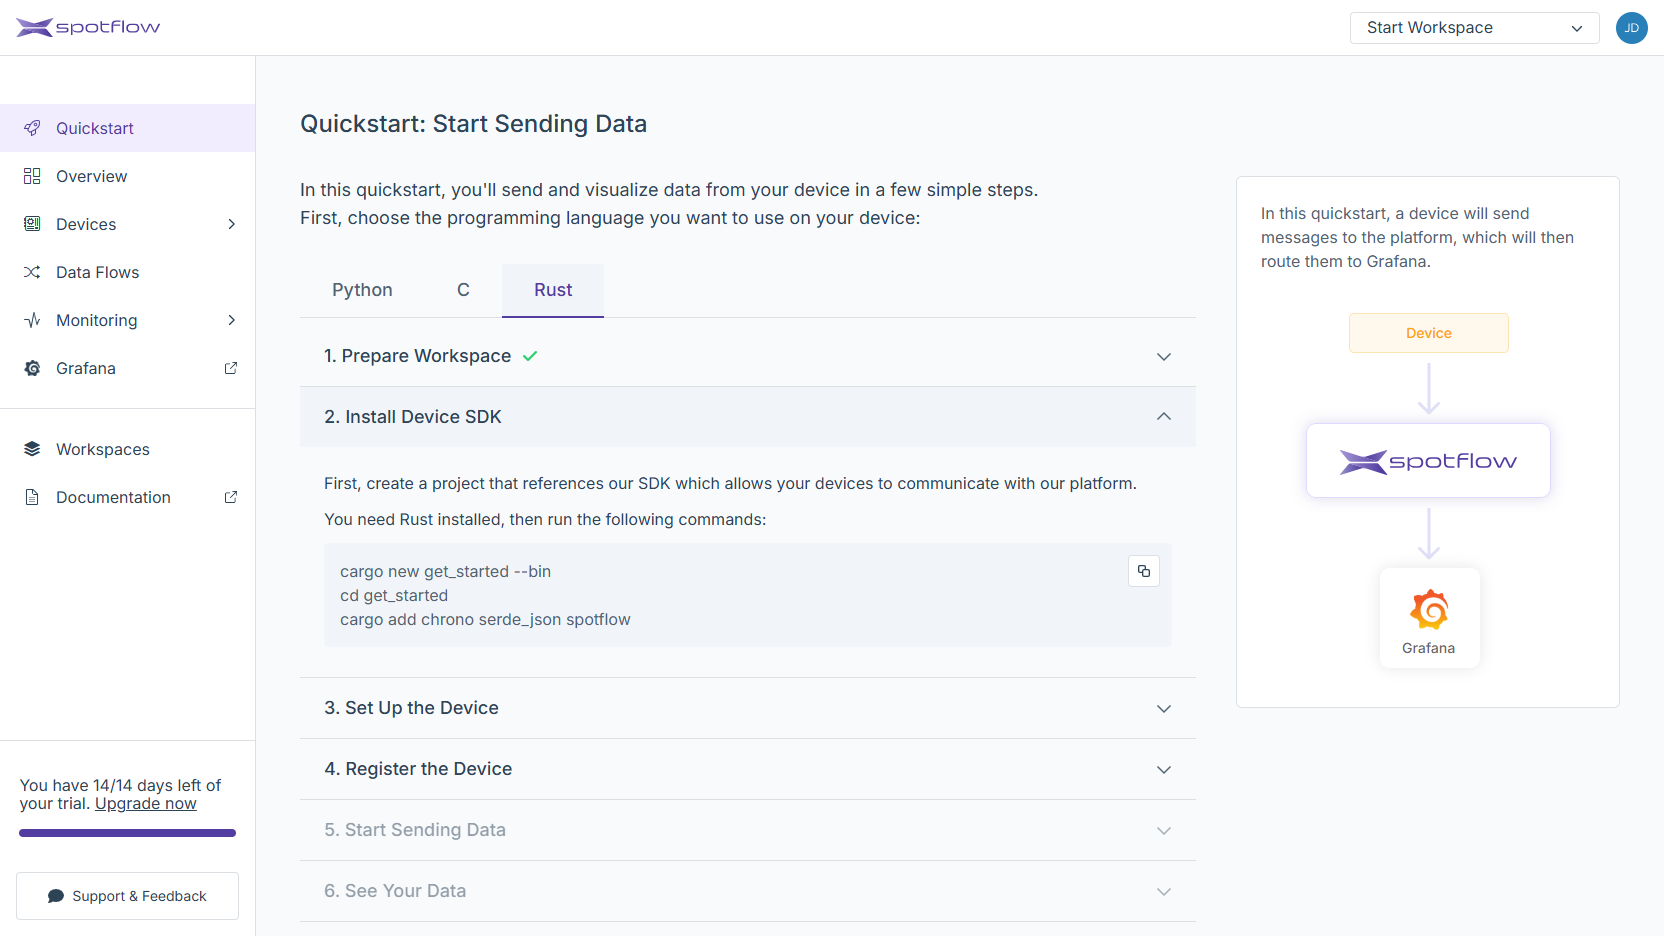
The Spotflow Device SDK is a library that enables you to connect your Devices to the Spotflow IoT Platform. The Device SDK provides the following features:
- Simple interface: Instead of manually calling the Platform API and communicating via MQTT, you can use the provided libraries for Python, C, and Rust.
- Data persistence: All the Messages are temporarily stored in a local database file until they are successfully sent to the Platform. Therefore, you don't have to worry about losing data if connection fails or the Device restarts.
- Connection handling: The Device SDK automatically reconnects to the Platform in the case of an Internet connection failure.
3. Set Up the Device
- Python
- C
- Rust
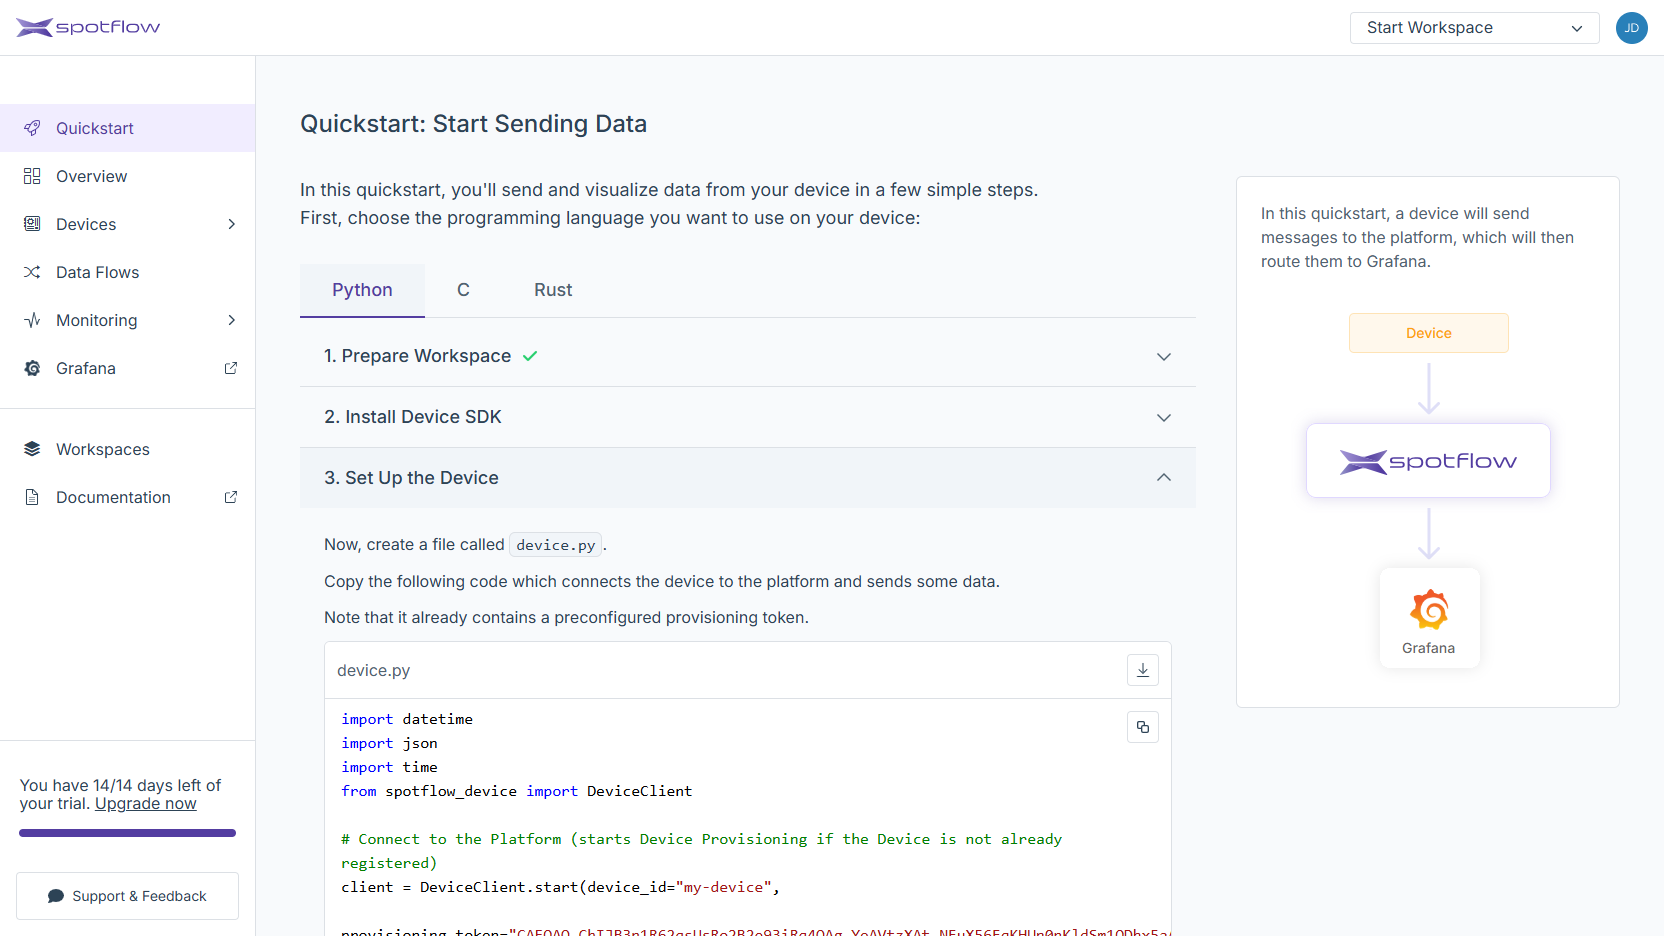
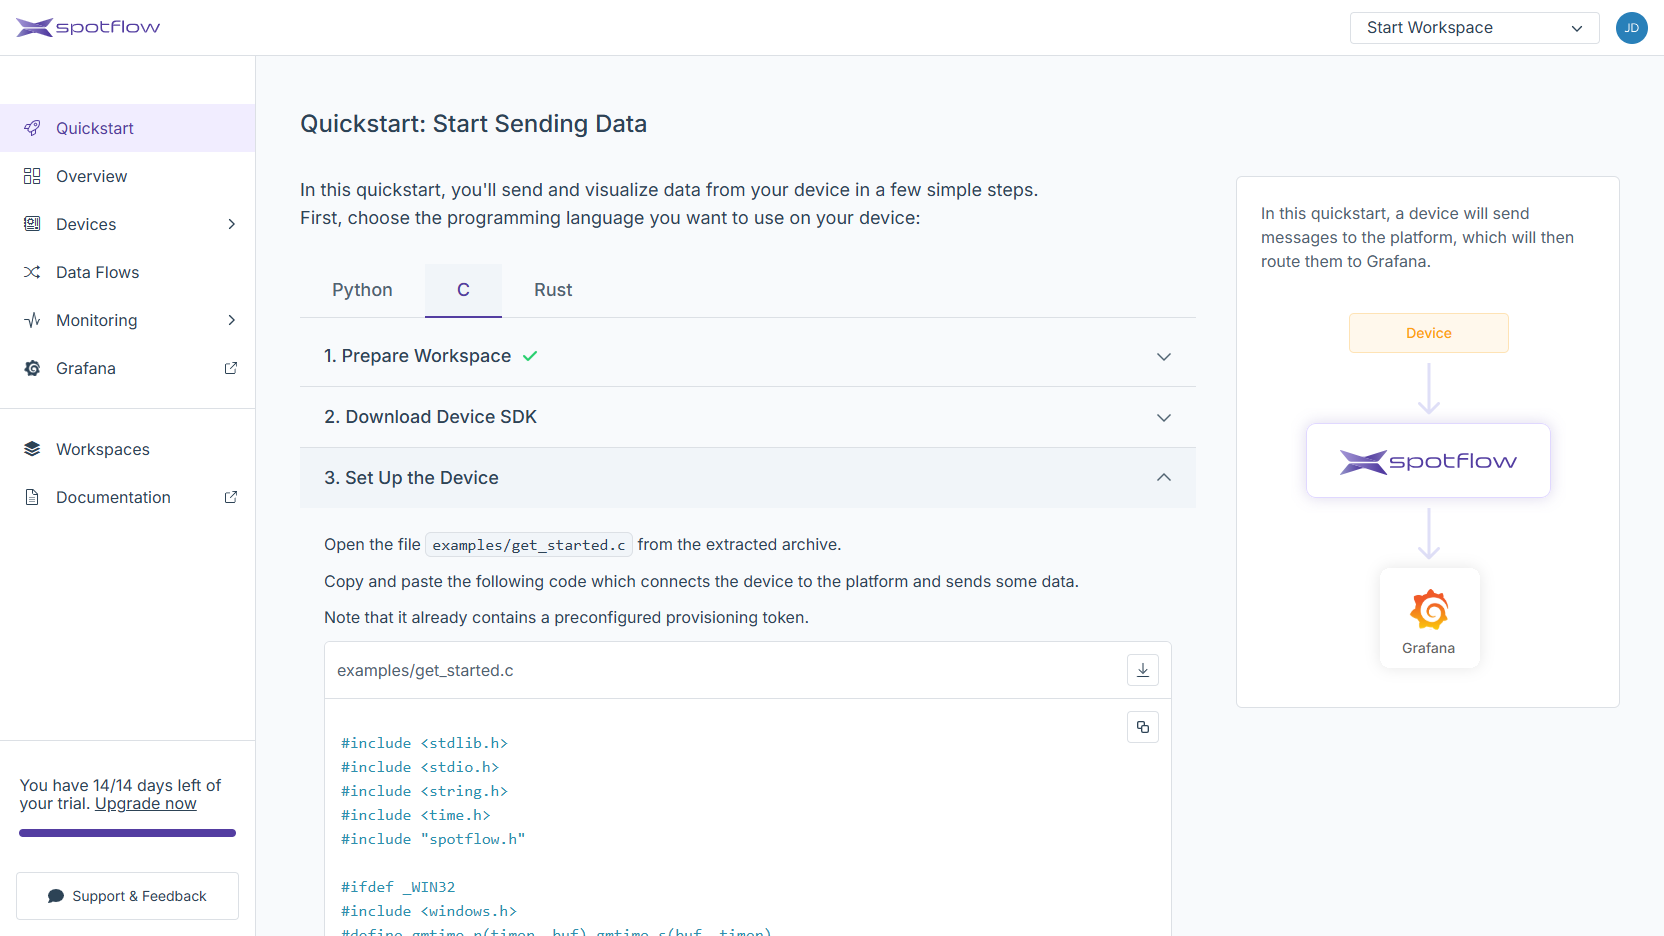
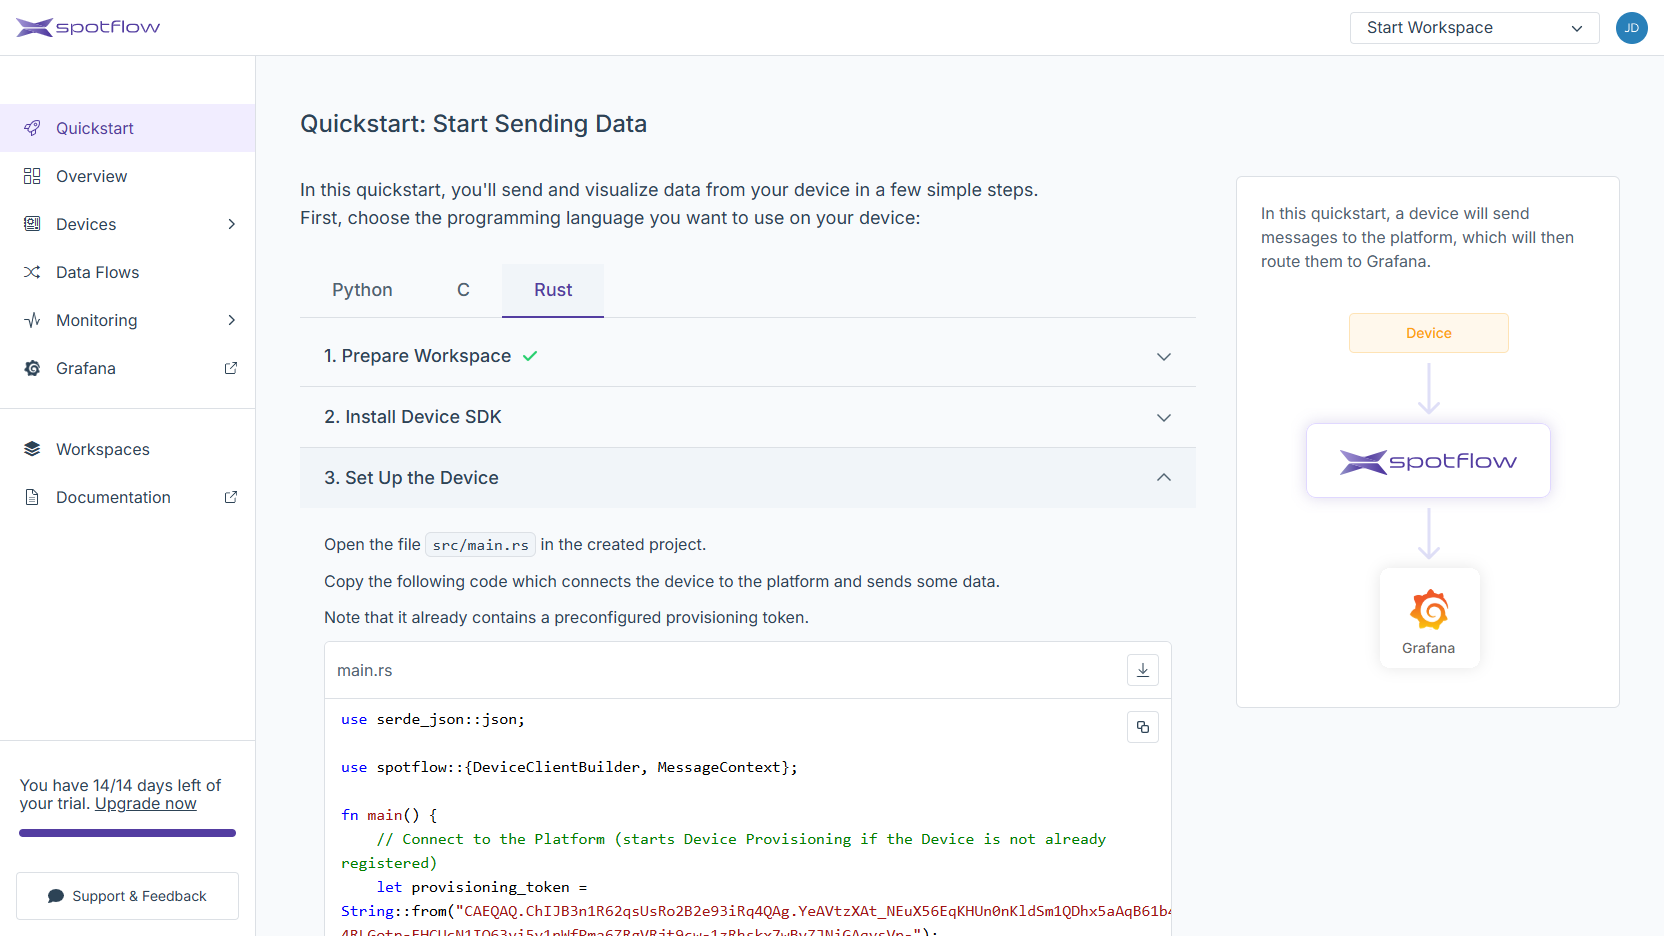
The example program shows how easy it is to use the Spotflow Device SDK to connect a Device and send data to the Platform. The SDK implements Device Provisioning adhering to the recommended security approaches crucial for protecting your data.
4. Register the Device
- Python
- C
- Rust
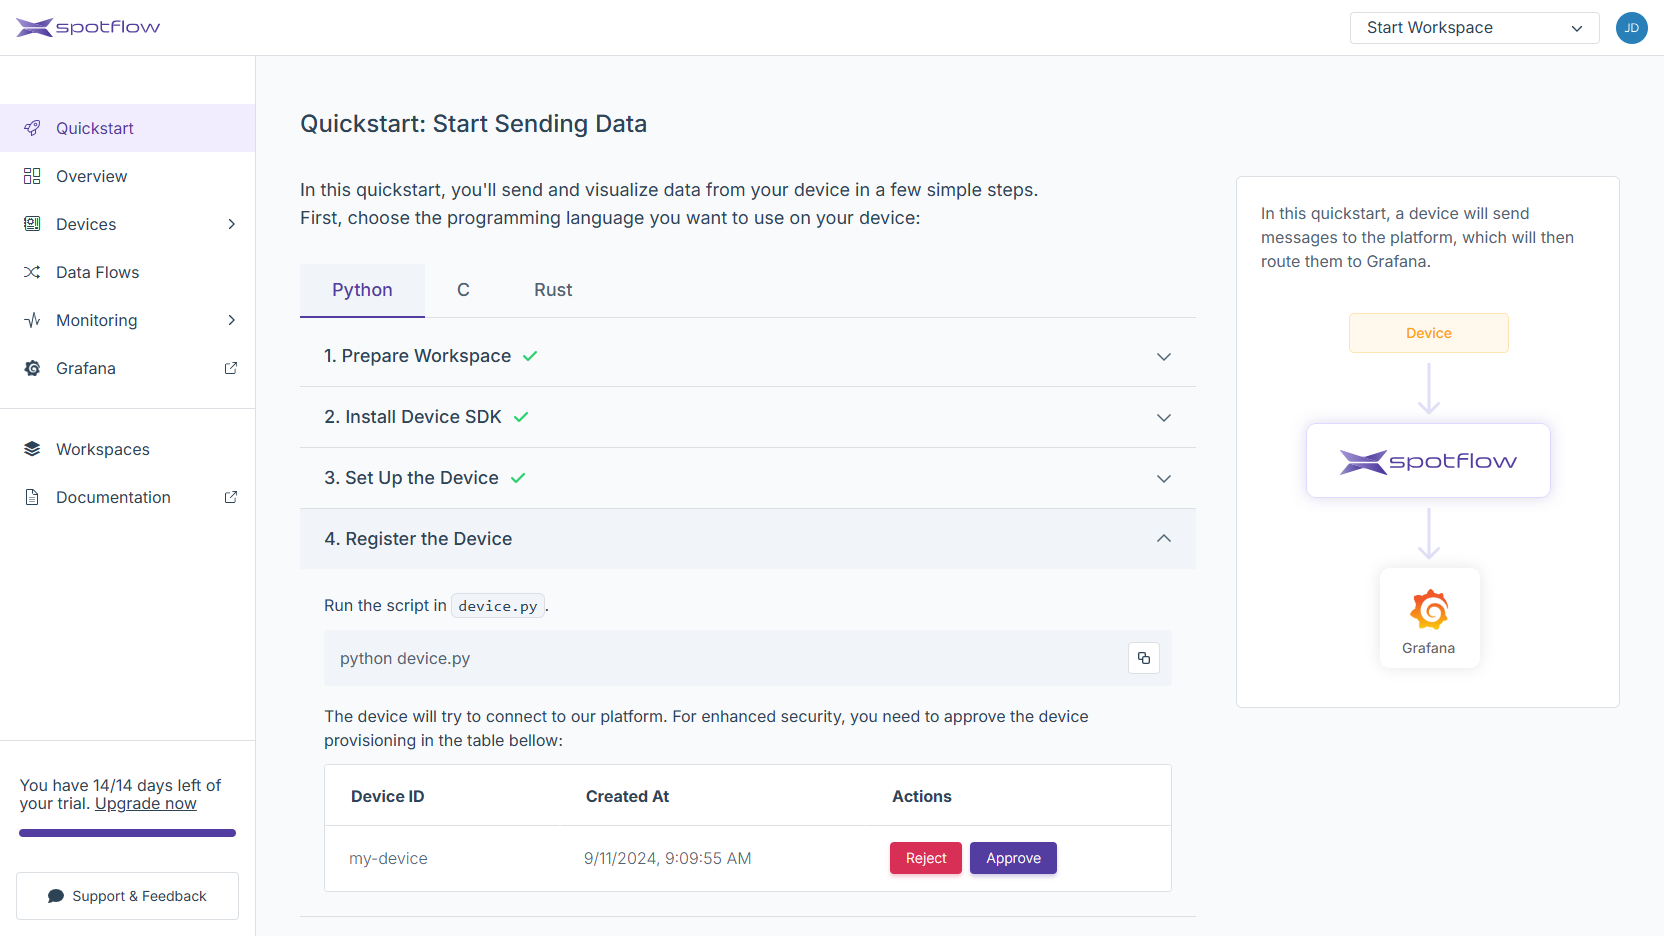
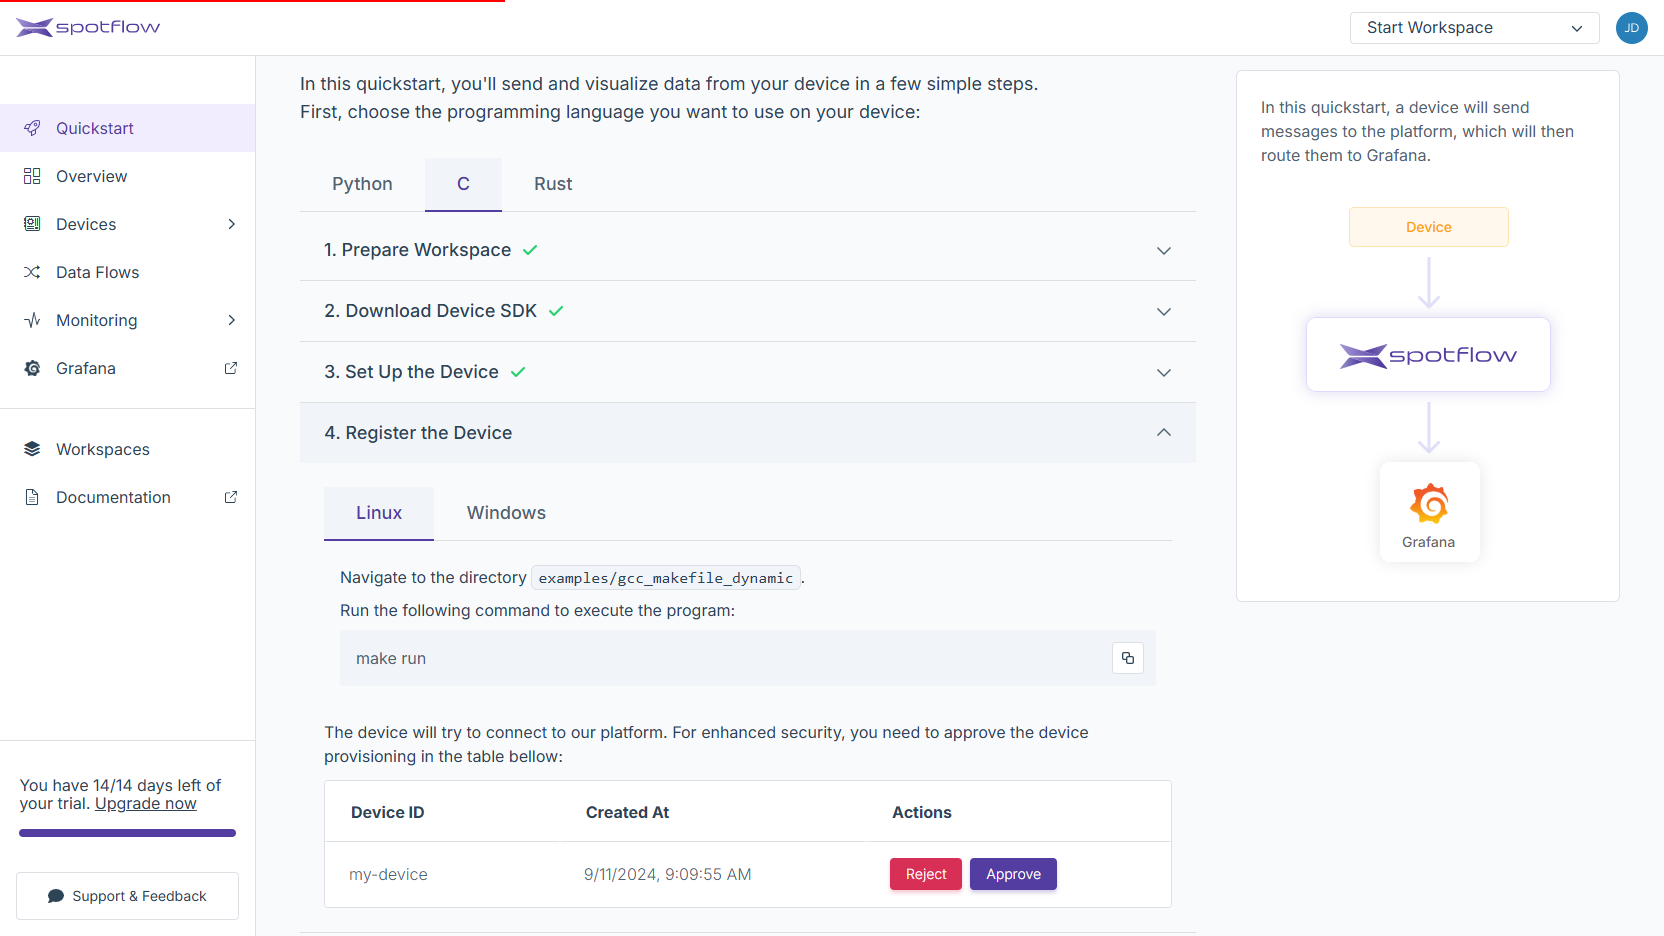
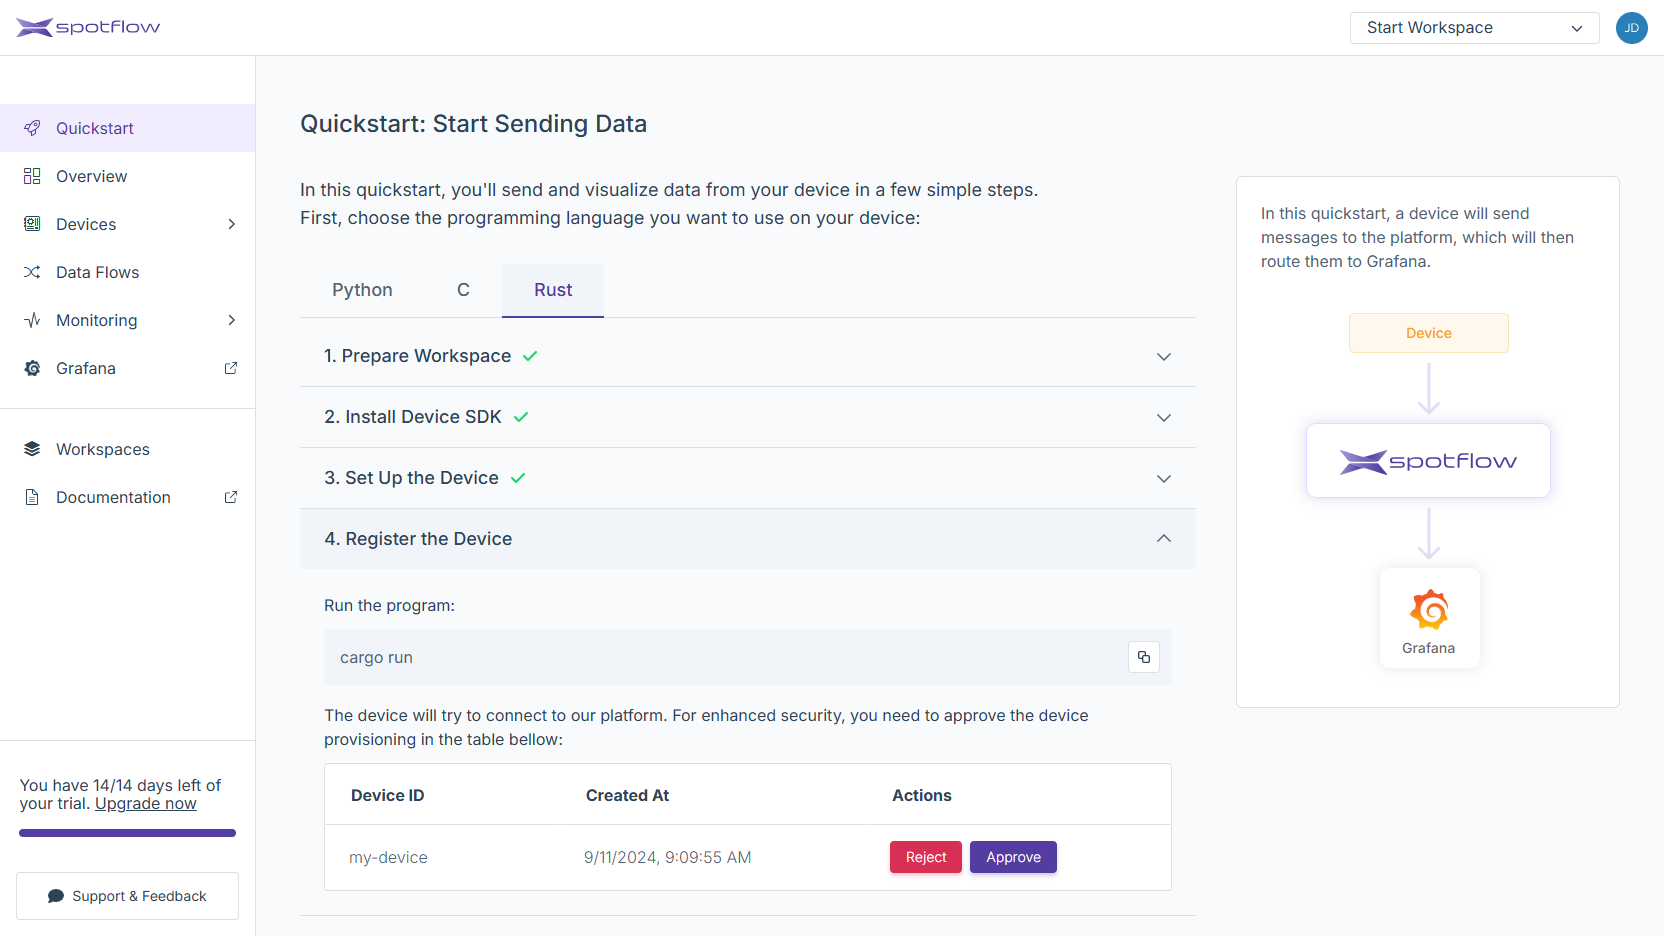
When you run the program, it initializes a Provisioning Operation.
The Device with ID my-device (as defined in the program) will appear in the table where you can approve its provisioning.
The program prints important information about the initialized Provisioning Operation:
Provisioning operation initialized, waiting for approval.
Operation ID: e17e8f1a-99df-442a-a0ff-061fc6f7bf56
Verification Code: 2a23bq52
Once you approve the Operation, the program obtains the credentials needed to connect to the Platform and can start sending Messages.
While the Quickstart simplifies the Device approval to a single click, the actual interface in the Portal displays a dialog window where you can check the Operation ID and Verification Code before approving the Device. See the related tutorial for more details.
5. Start Sending Data
- Python
- C
- Rust
The program promptly starts sending Messages to the Stream default-stream.
It also prints the data to your console:
{"timestamp": "2024-05-27T14:28:45.783948+02:00", "temperatureCelsius": 21.05}
{"timestamp": "2024-05-27T14:28:47.610918+02:00", "temperatureCelsius": 21.1}
{"timestamp": "2024-05-27T14:28:48.820547+02:00", "temperatureCelsius": 21.15}
{"timestamp": "2024-05-27T14:28:50.035763+02:00", "temperatureCelsius": 21.2}
...
All the received data is always stored in Stream Storage. As per your data flow demands, it might also be forwarded to another system for further exploration and processing.
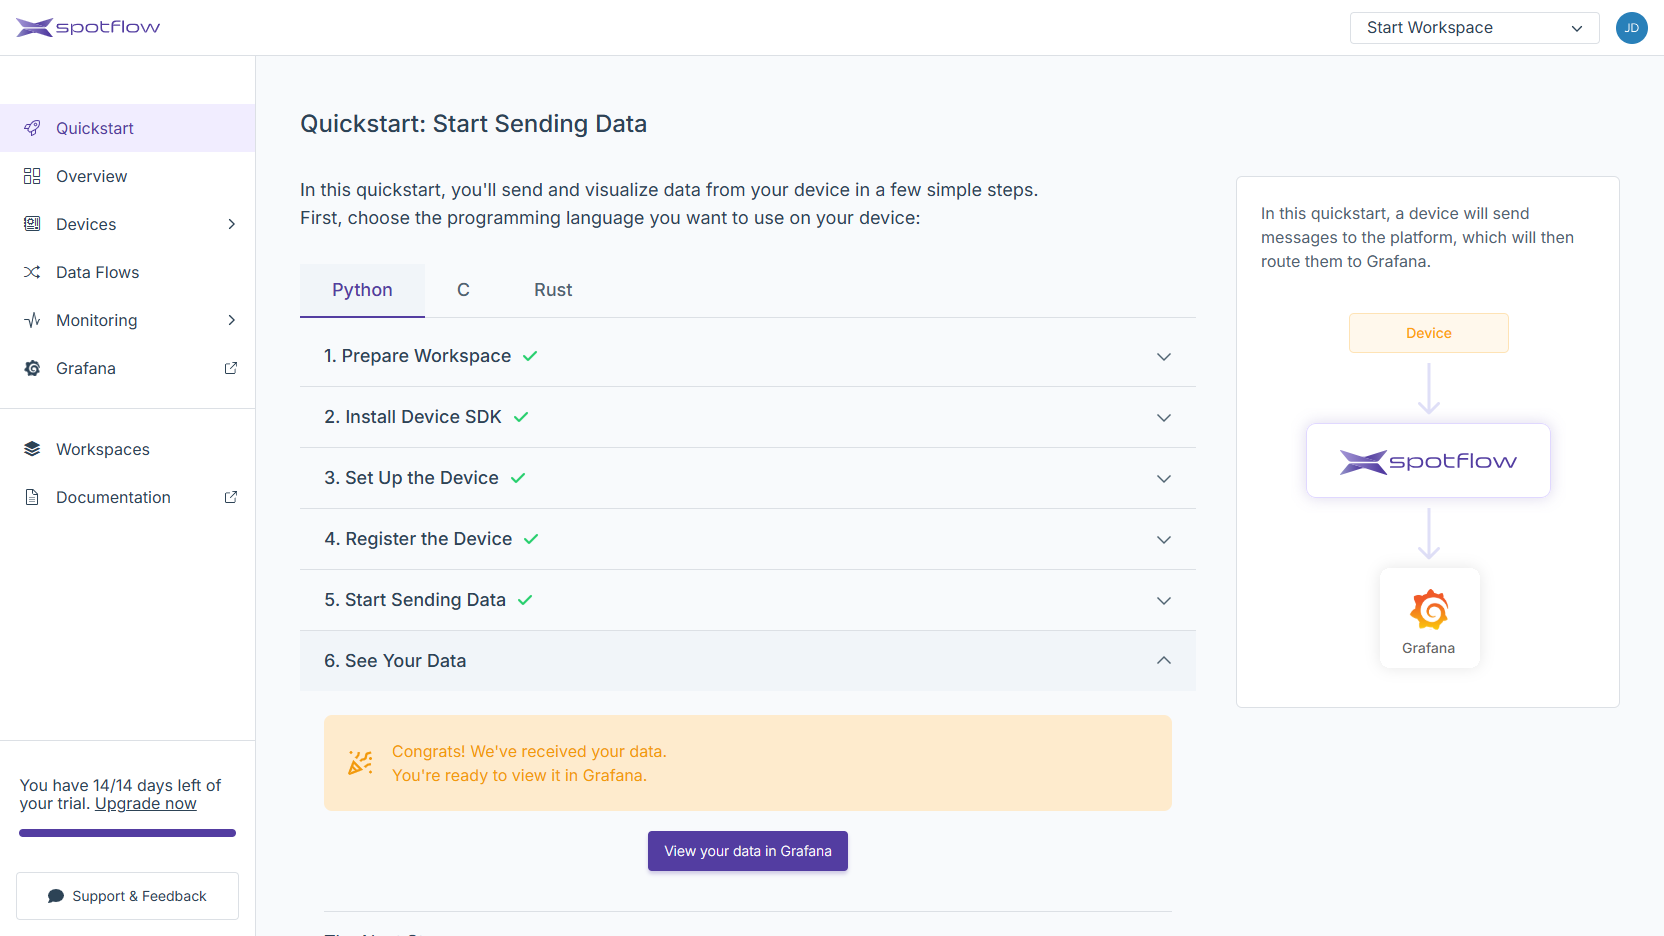
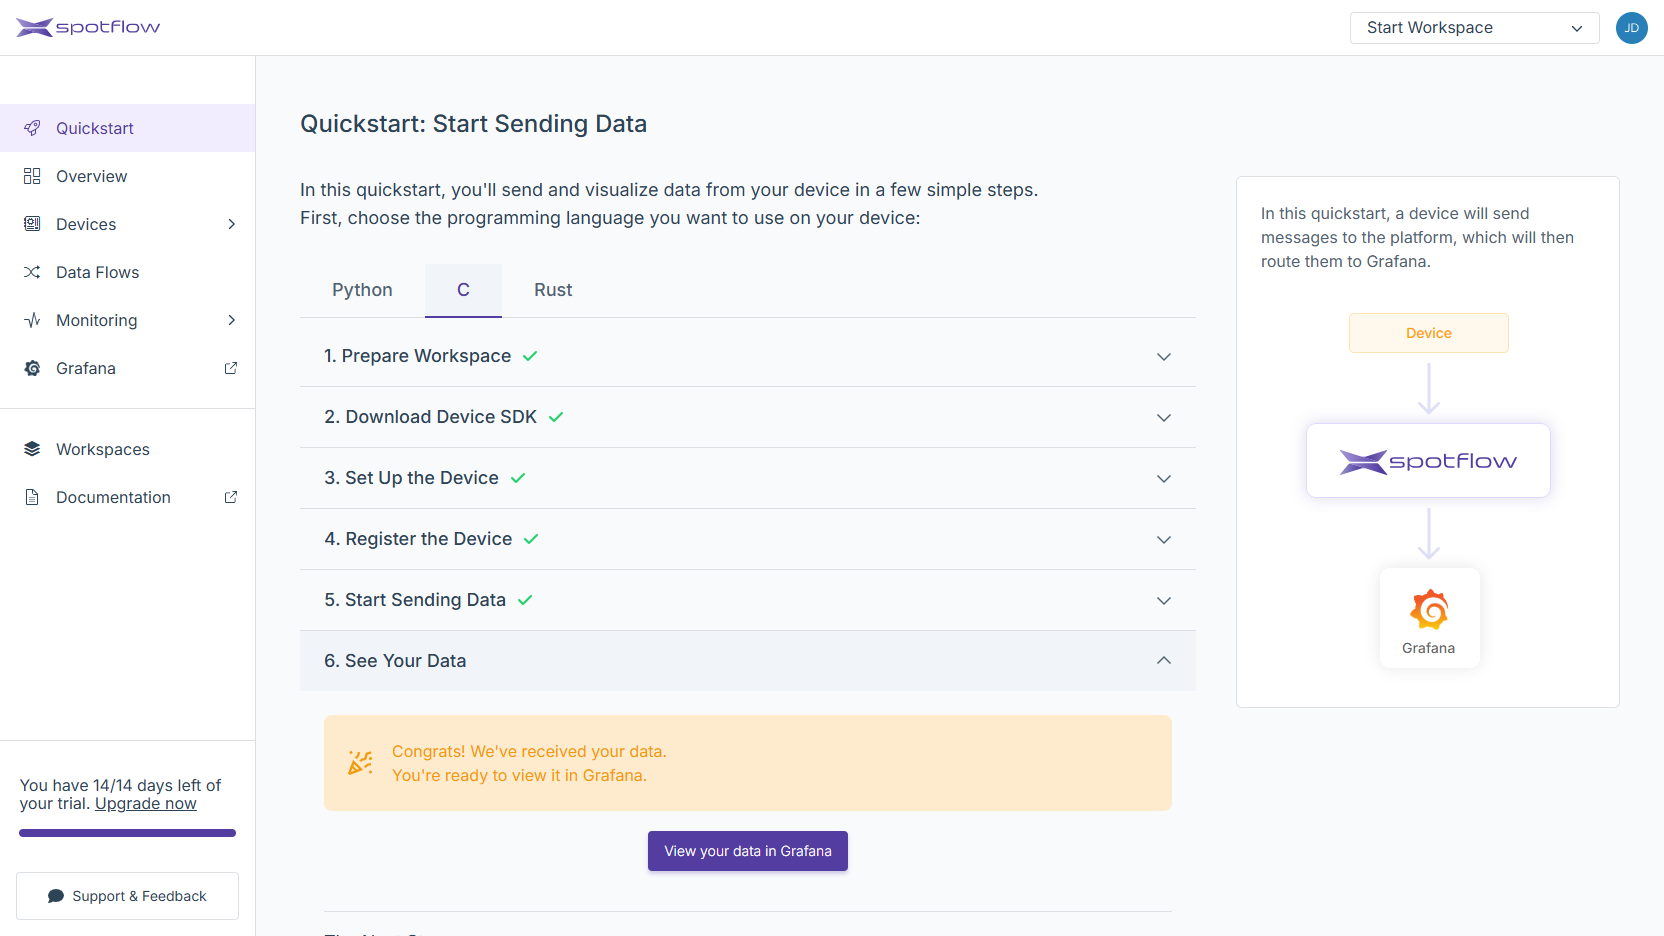
6. See Your Data
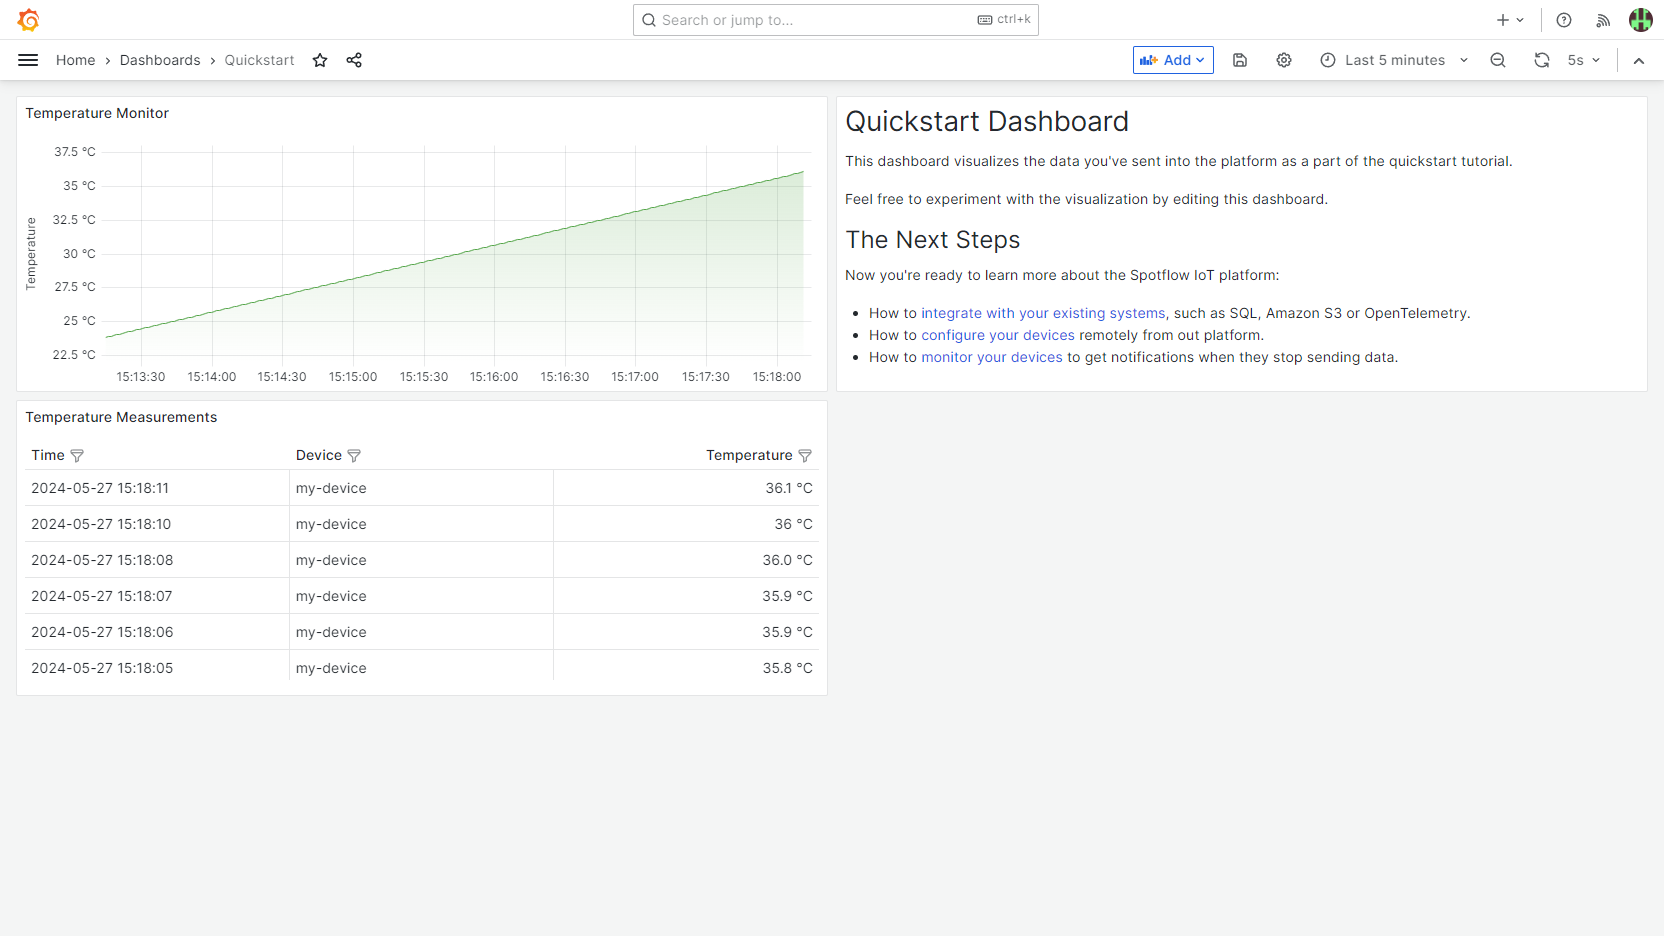
Messages sent to the Stream default-stream are automatically forwarded to the integrated instance of Grafana.
By clicking View your data in Grafana you are redirected to the Quickstart dashboard in Grafana.
The dashboard auto-refreshes every 5 seconds, allowing you to see new data appearing in near real-time if your program is still running.
What's Next
- See Connect Devices on how to securely connect multiple Devices in production.
- See Consume Data in Your Systems to understand how to integrate with your existing systems, such as SQL, Amazon S3 or OpenTelemetry.
- See Configure Devices Remotely to configure your Device fleet remotely from the Platform.
- See Monitor Devices to get notifications when your Devices stop sending data.