Tutorial: Visualize Data in Spotflow Grafana
This tutorial will show you how to send your data from the Device and visualize in the integrated instance of Grafana.
Requirements
- If you are not registered to the Spotflow IoT Platform yet, Sign Up.
- You need to have an existing Stream.
A Stream called
default-streamin Stream Groupdefault-stream-groupis created automatically after you register. Create a new one if you want to use a different Stream. - You need to have an existing Provisioning Token
1. Configure Route to Spotflow Grafana
Your Start Workspace has the Stream default-stream in the Stream Group default-stream-group already configured to route incoming data to the integrated instance of Grafana.
You need to follow these steps below only if you want to use a different Stream or Workspace.
- Portal
- CLI
- API
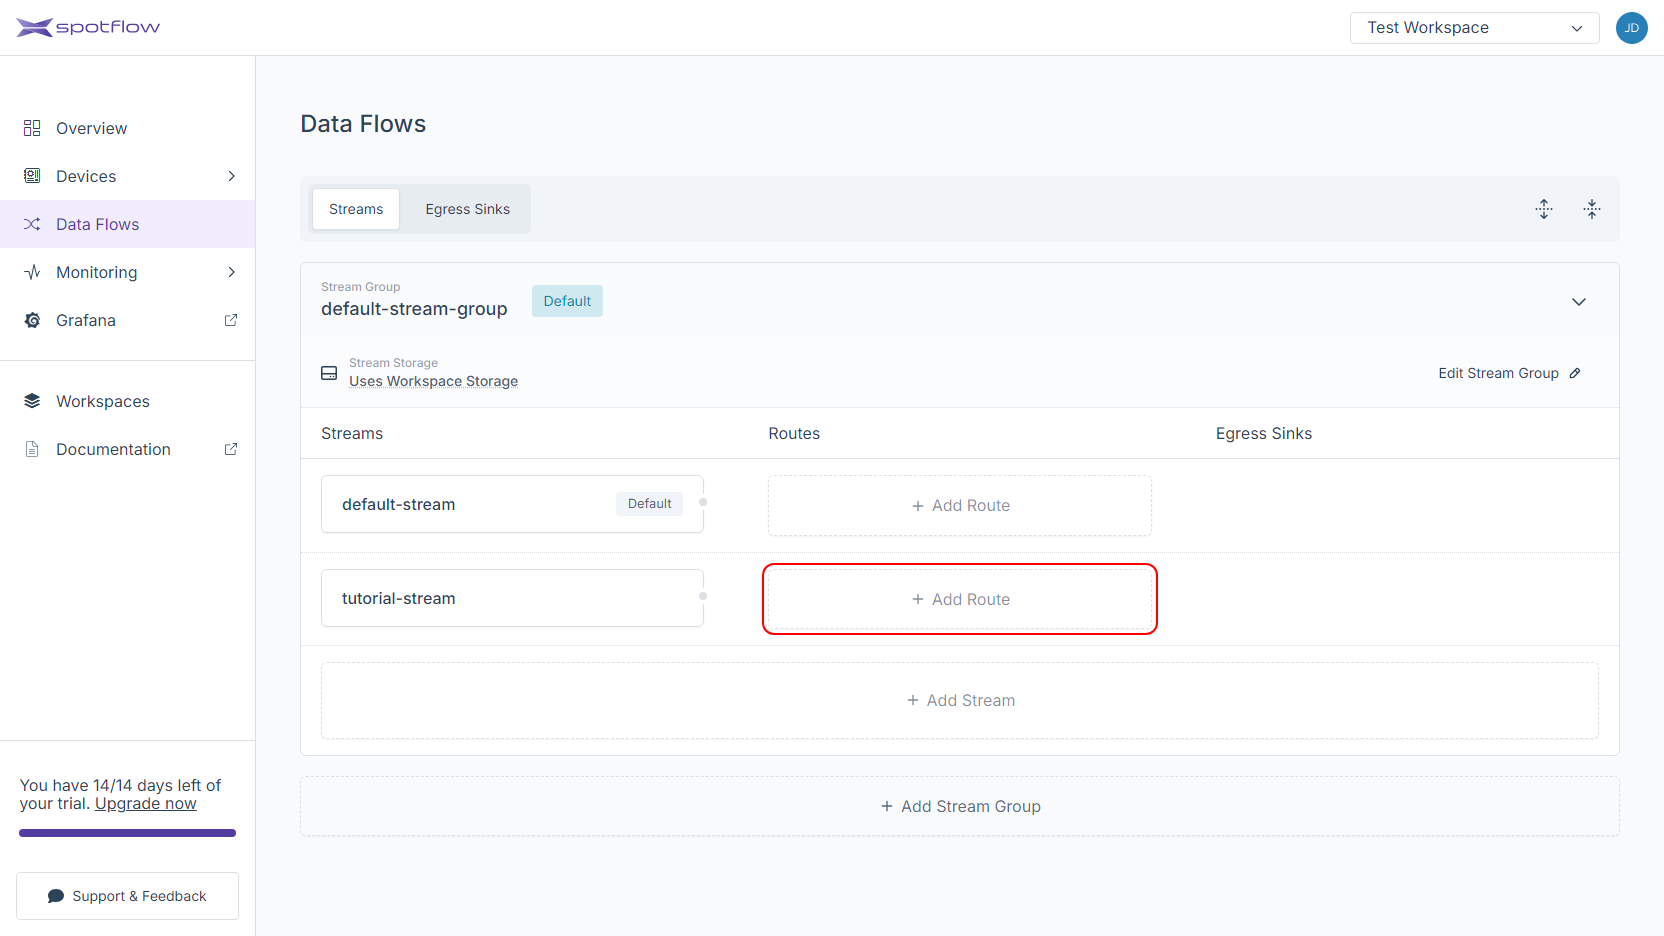
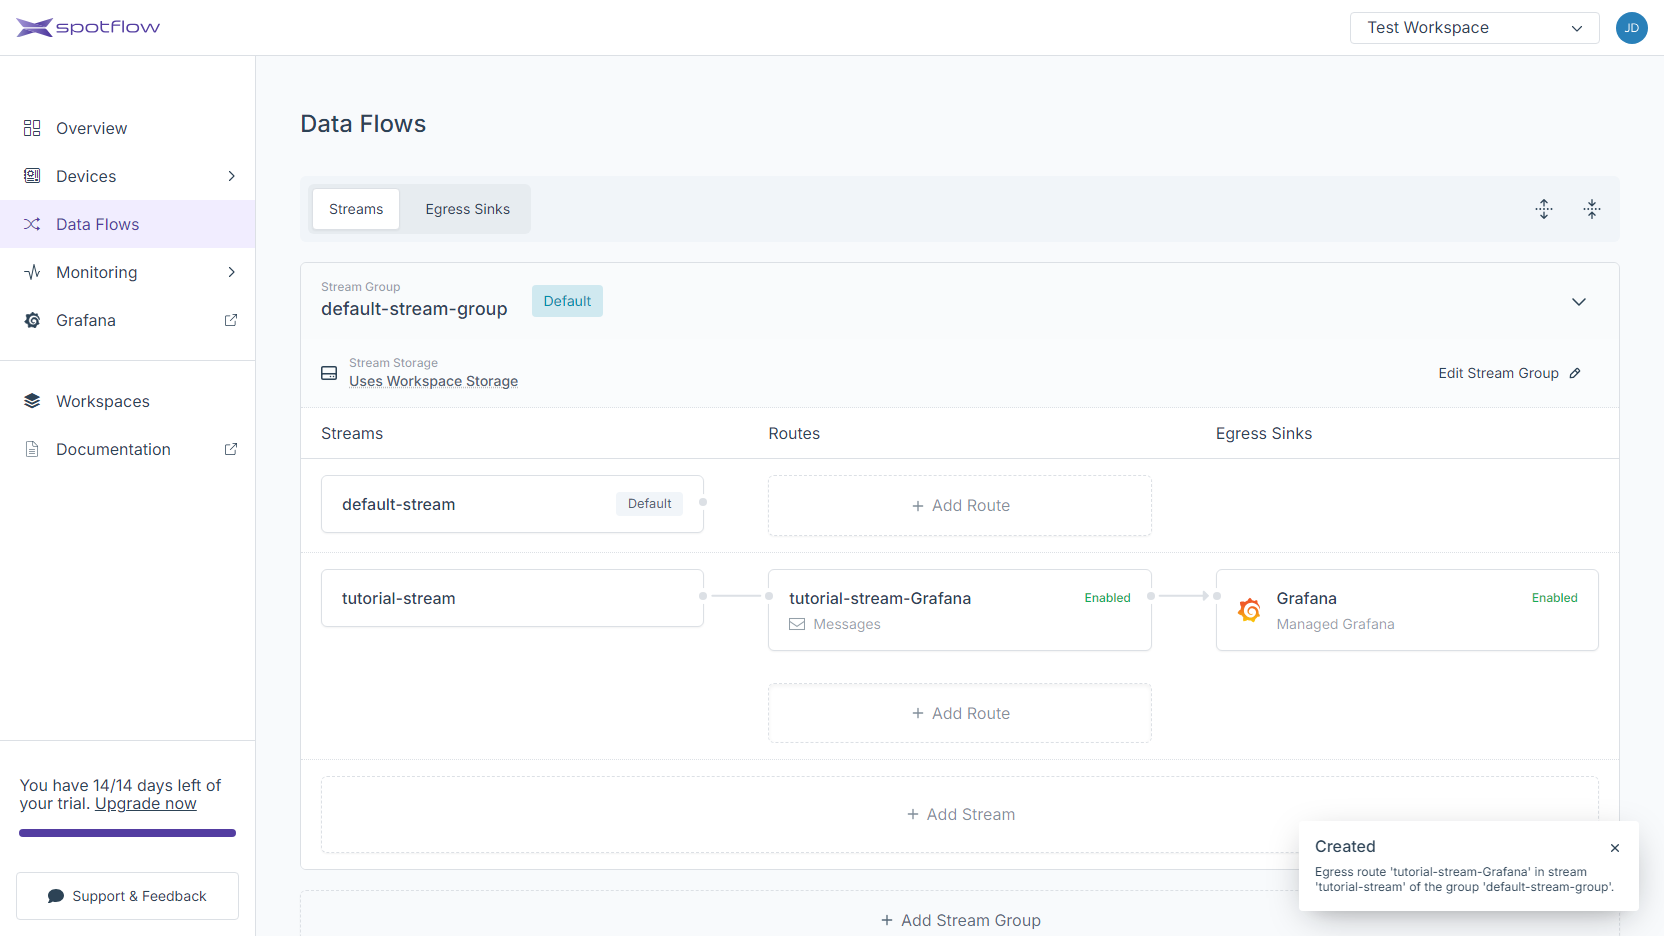
Click on Data Flows in the left sidebar.
Click on the Add Route button next to the stream that should be routed to the Grafana.
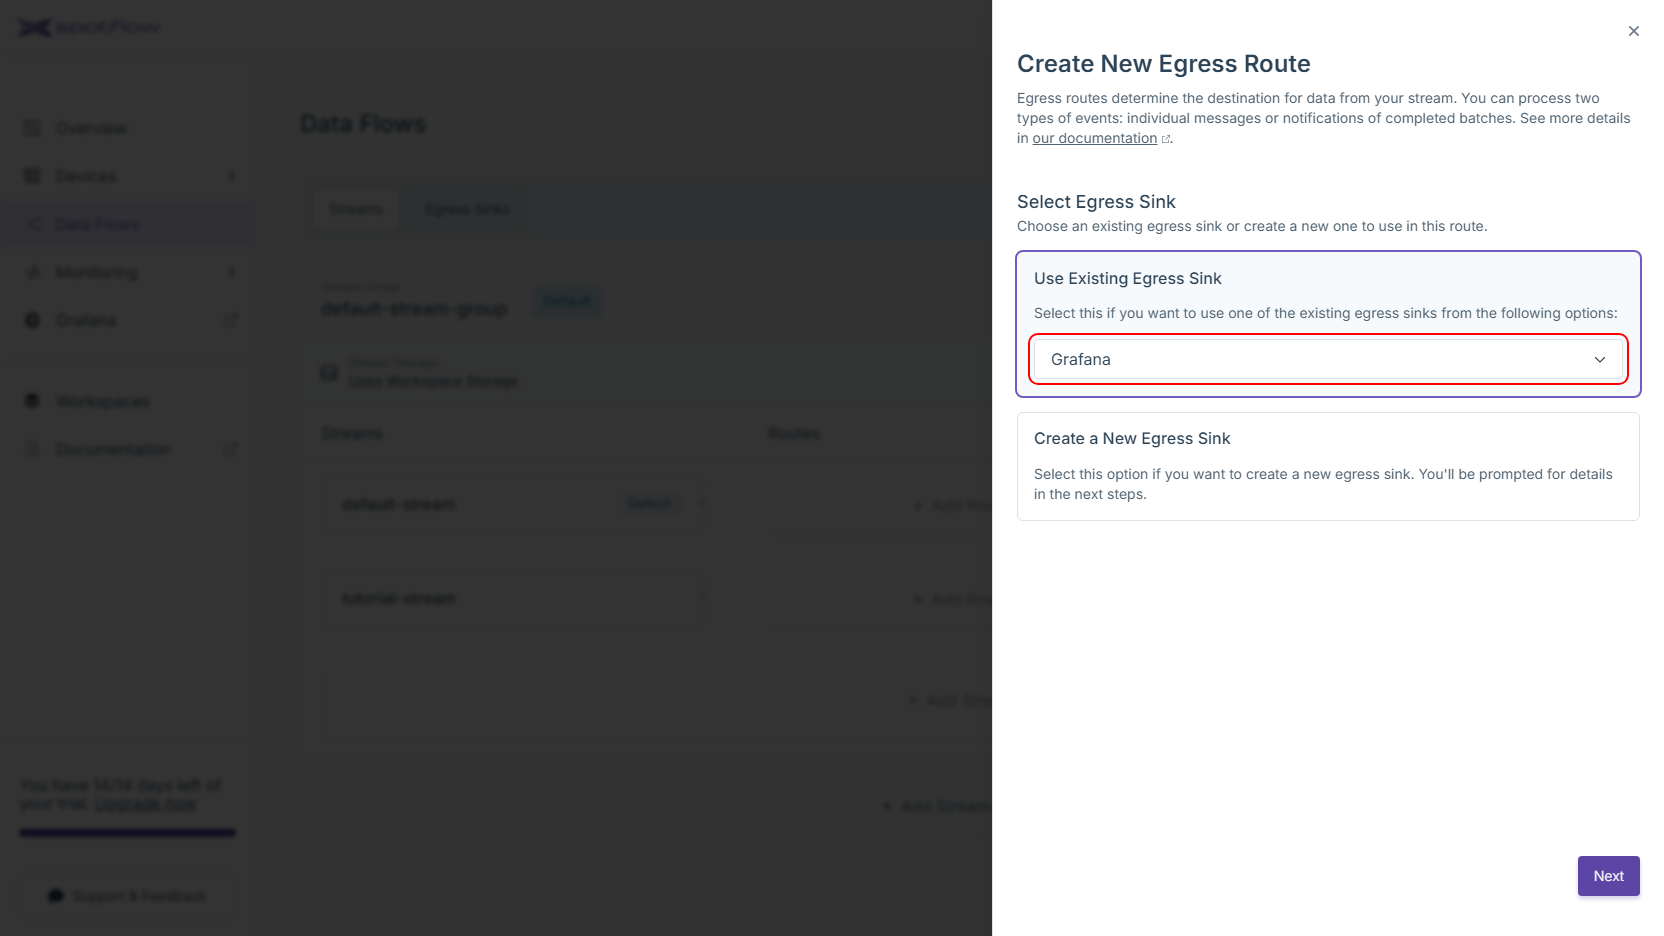
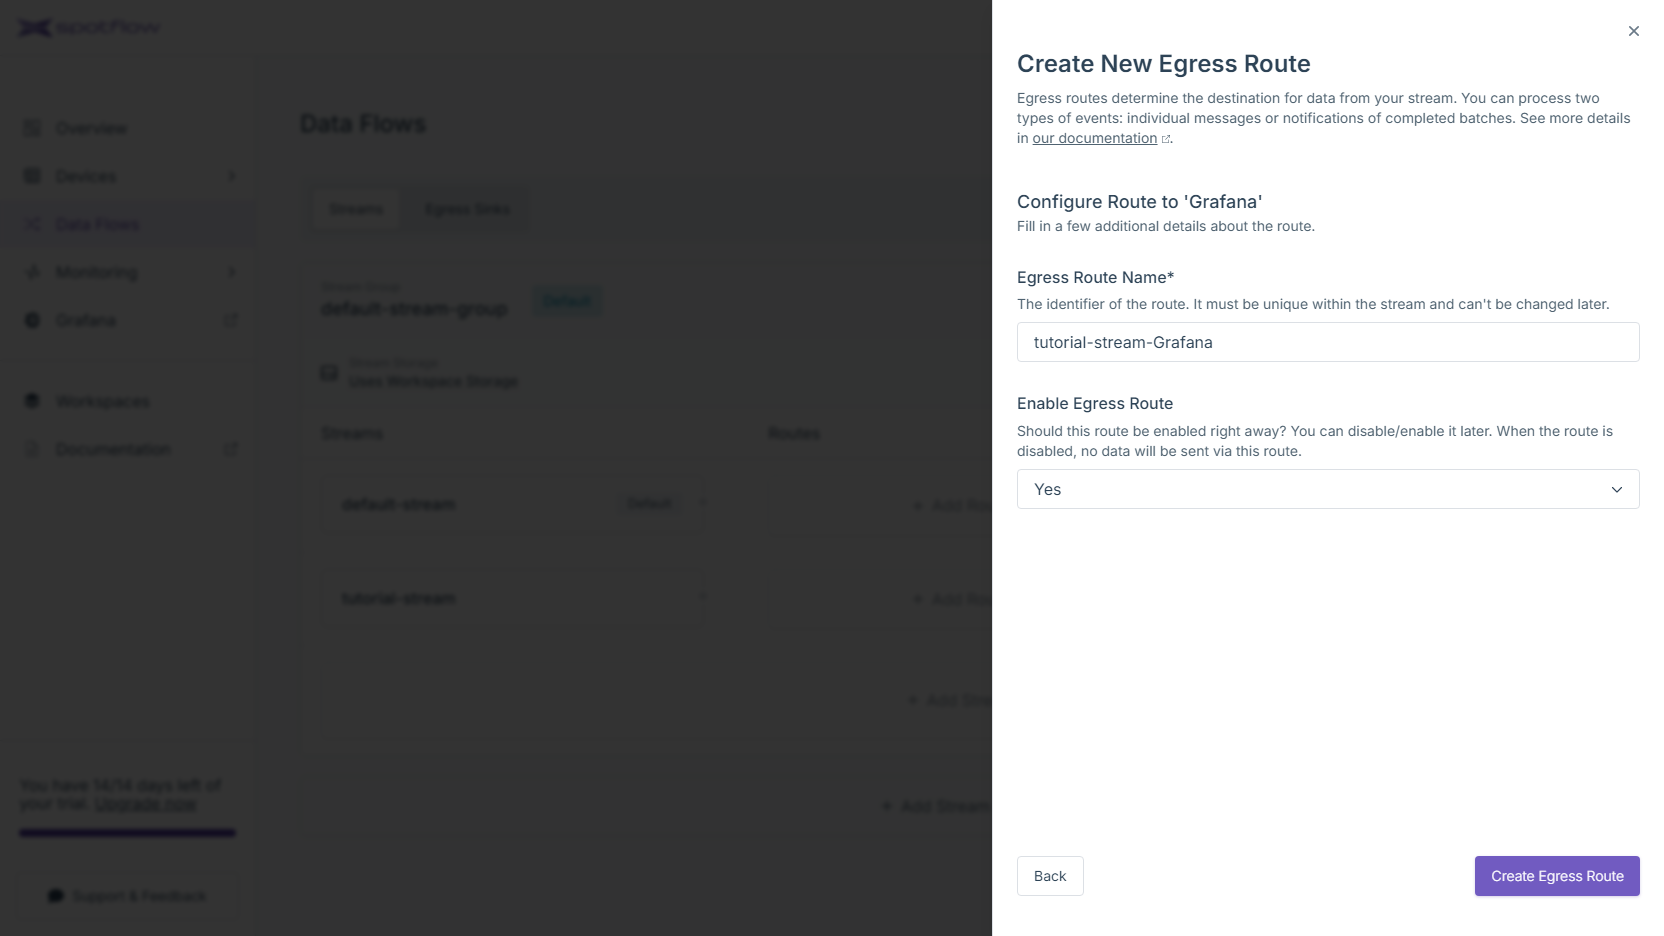
Choose
Grafanaas the existing egress sink to to use. Click Next.Review the default configuration and optionally customize it. Configure the path where the we should store the Delta table. Click Create Egress Route to finish.
The route to Grafana has been created! You should see an arrow going from your stream to the Egress Sink.
Supposing you have already installed the CLI and logged in,
replace placeholders <Your Stream Group Name> and <Your Stream Name> with your Stream Group name, and your Stream name and run the following command:
spotf stream egress-route create-or-update grafana --stream-group-name "<Your Stream Group Name>" --stream-name "<Your Stream Name>" --egress-route-name "route-to-grafana"
The CLI will confirm the creation and display the Egress Route details:
info: Spotflow.IotPlatform.Cli.App.Commands.DataFlows.Streams.EgressRoutes.StreamEgressRouteCreateOrUpdateEventHubCommand[0]
      Egress Route 'route-to-grafana' for Stream '<Your Stream Name>' in Stream Group '<Your Stream Group Name>' created successfully.
Name: Grafana
WorkspaceId: 52aefb52-6ed8-453e-83e9-0048511f7ce9
StreamGroupName: <Your Stream Group Name>
StreamName: <Your Stream Name>
Properties
├── IsEnabled: true
├── EgressSinkName: Grafana
├── Config
└── Input: Messages
The following instructions expect that you have already obtained the API access token from the Portal and that you know the ID of the Workspace you want to use. If you don't know the Workspace ID, you can find it in the Portal under the link Workspaces in the left sidebar.
Replace the placeholders <Your Workspace ID>, <Your API Access Token>, <Your Stream Group Name> and <Your Stream Name> with your Workspace ID, API access token,
your Stream Group name, your Stream name and run the following command to create a new Egress Route:
- cURL
- PowerShell
curl -X PATCH 'https://api.eu1.spotflow.io/workspaces/<Your Workspace ID>/stream-groups/<Your Stream Group Name>/streams/<Your Stream Name>/egress-routes/route-to-grafana' \
 -H 'Content-Type: application/json' \
 -H 'Accept: application/json' \
 -H 'Authorization: Bearer <Your API Access Token>' \
 -d '{"properties": {"egressSinkName": "route-to-grafana"}}'
(Invoke-WebRequest -Method Patch -Uri 'https://api.eu1.spotflow.io/workspaces/<Your Workspace ID>/stream-groups/<Your Stream Group Name>/streams/<Your Stream Name>/egress-routes/route-to-grafana' `
 -Headers @{
   'Content-Type' = 'application/json'
   'Accept' = 'application/json'
   'Authorization' = 'Bearer <Your API Access Token>'
 } `
 -Body '{"properties": {"egressSinkName": "route-to-grafana"}}').Content
The API will confirm the creation and display the Egress Route details:
{
  "name": "route-to-grafana",
  "workspaceId": "<Your Workspace ID>",
  "streamGroupName": "<Your Stream Group Name>",
  "streamName": "<Your Stream Name>",
  "version": 1,
  "properties": {
    "isEnabled": true,
    "egressSinkName": "Grafana",
    "config": {},
    "input": "Messages"
  }
}
2. Send Data to Platform
Follow Tutorial: Send Data to Platform to send data to the Platform.
Do not forget to send data to the Stream you configured in step 2!
If you successfully followed the previous steps, your Device is sending data to the Platform and the data is forwarded to the Spotflow Grafana.
Message Format
Messages routed to Grafana Egress Sink must be in the following format:
- The Message must be a JSON document encoded in UTF-8. The document root must be an object or an array of objects. Otherwise, the message is skipped.
- The field
timestampis required in each top-level object. The field must contain an ISO 8601 timestamp string. Otherwise, the object is skipped. - A field name can contain only the characters
0-9,a-z,A-Z,_, and:. It also can't start with a number. If the field name doesn't conform to this format, it's skipped. - A field value can be an object, a number, or a boolean. Objects are parsed recursively. Numbers are directly translated into data points; booleans are converted to 0 or 1 before that. Fields with other value types are skipped.
Example:
{
  "timestamp": "2023-04-03T15:16:03+01:00",
  "temperatureCelsius": 21.6,
  "revolutionsPerMinute": 7200
}
One message can also contain multiple data points and nested objects:
[
  {
    "timestamp": "2023-04-03T15:16:03+01:00",
    "machine": {
        "temperatureCelsius": 21.6,
        "revolutionsPerMinute": 7200
    },
    "weather": {
        "temperatureCelsius": 18.5,
        "humidityPercent": 65.8
    }
  },
  {
    "timestamp": "2023-04-03T15:17:03+01:00",
    "machine": {
        "temperatureCelsius": 21.9,
        "revolutionsPerMinute": 7201,
    },
    "weather": {
        "temperatureCelsius": 18.5,
        "humidityPercent": 65.8
    }
  },
]
3. Visualize Data in Spotflow Grafana
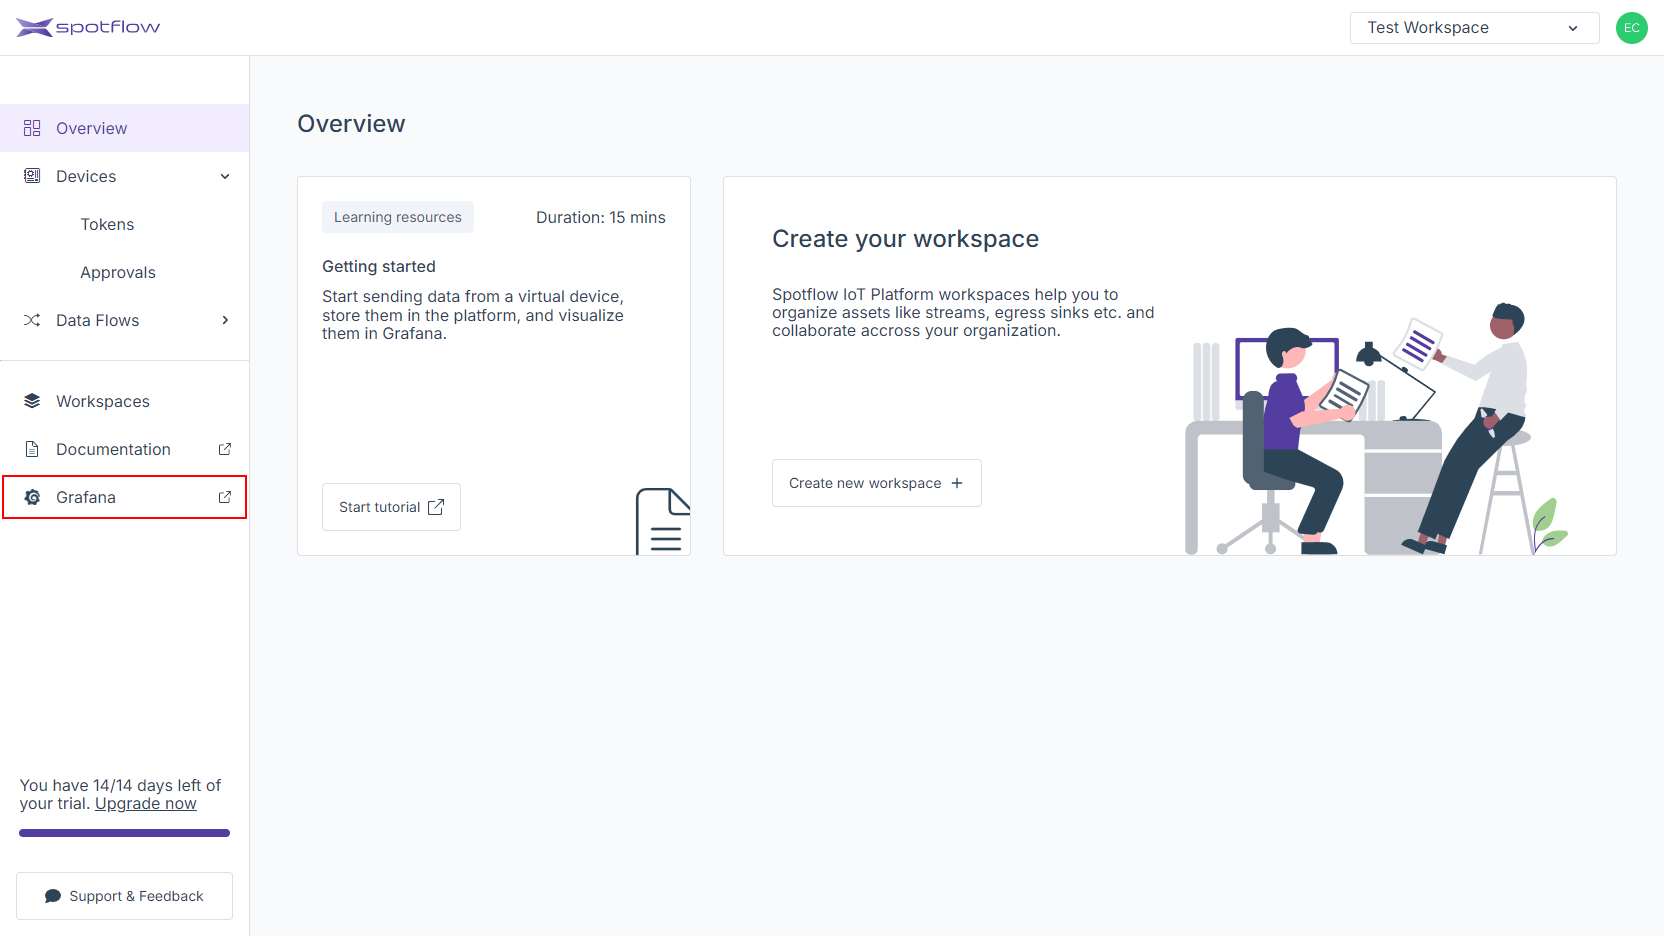
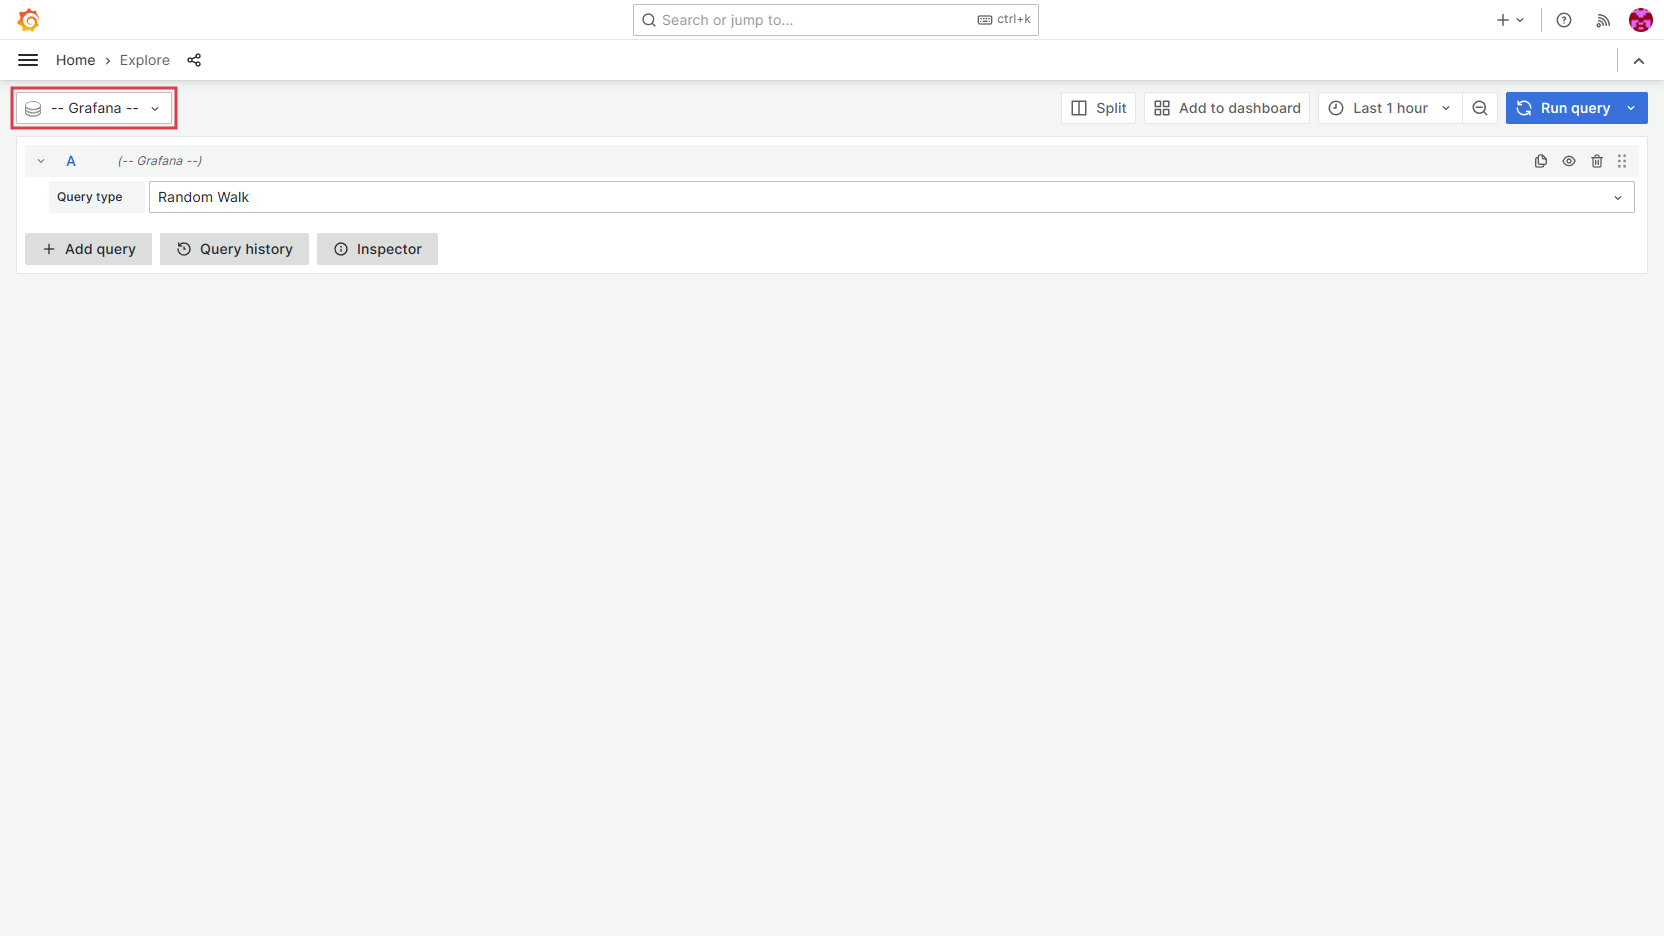
Open the link Grafana in the left sidebar.
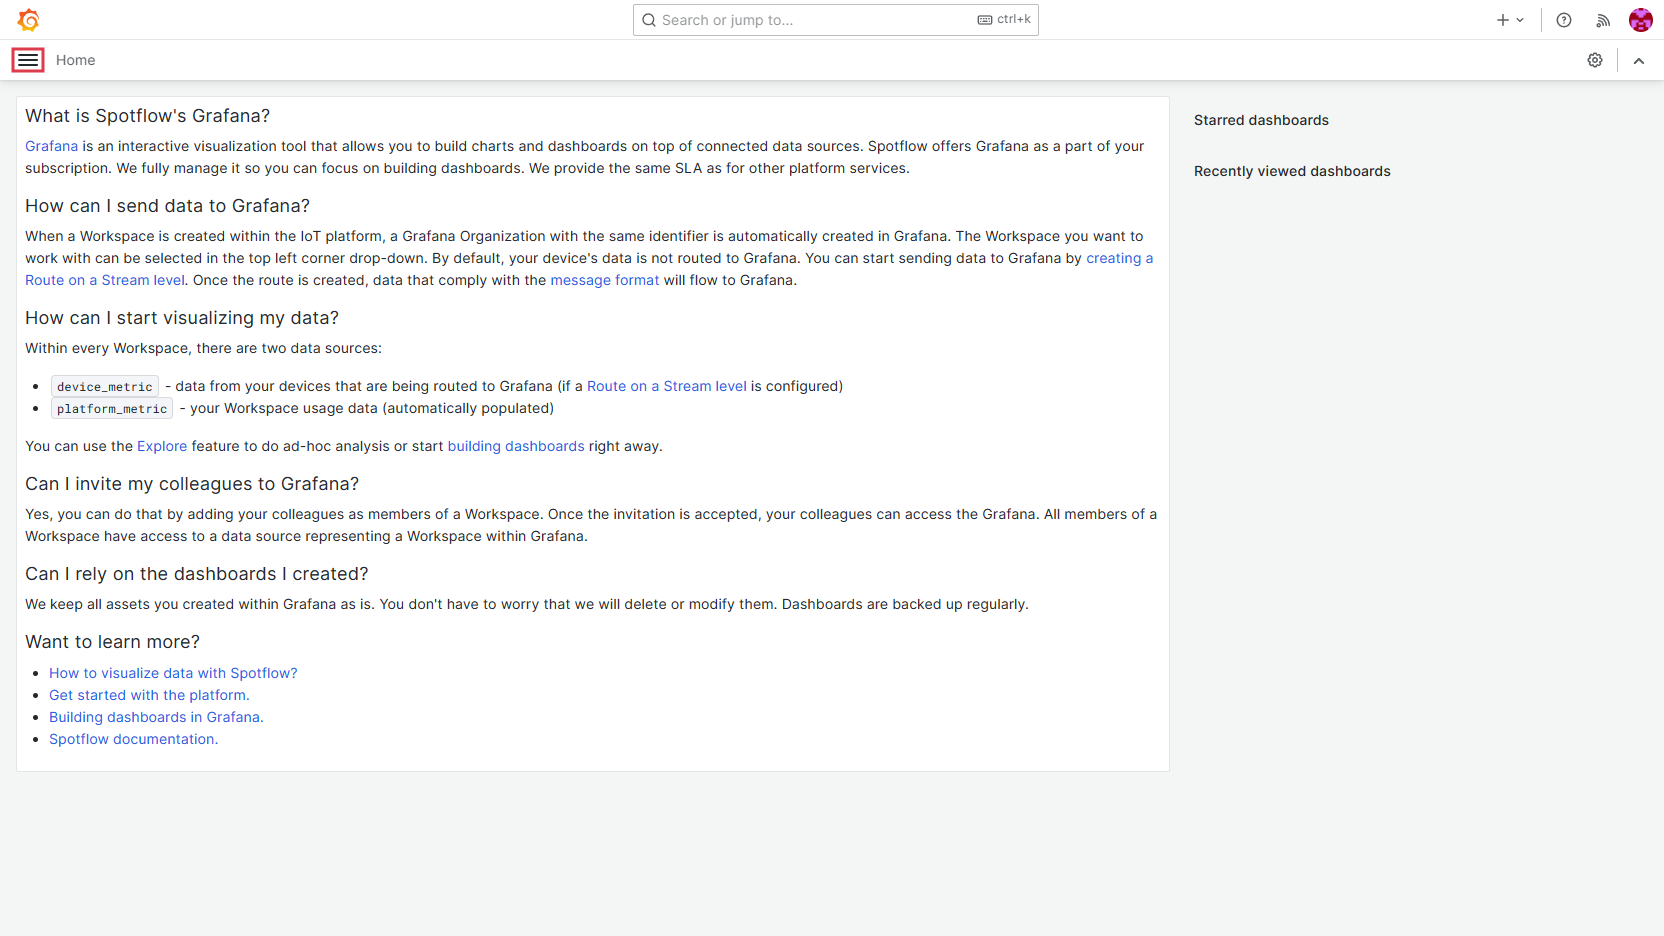
The Home page of the integrated instance of Grafana will open in a new browser tab. It answers some common questions about how you can use it. Click the menu icon.
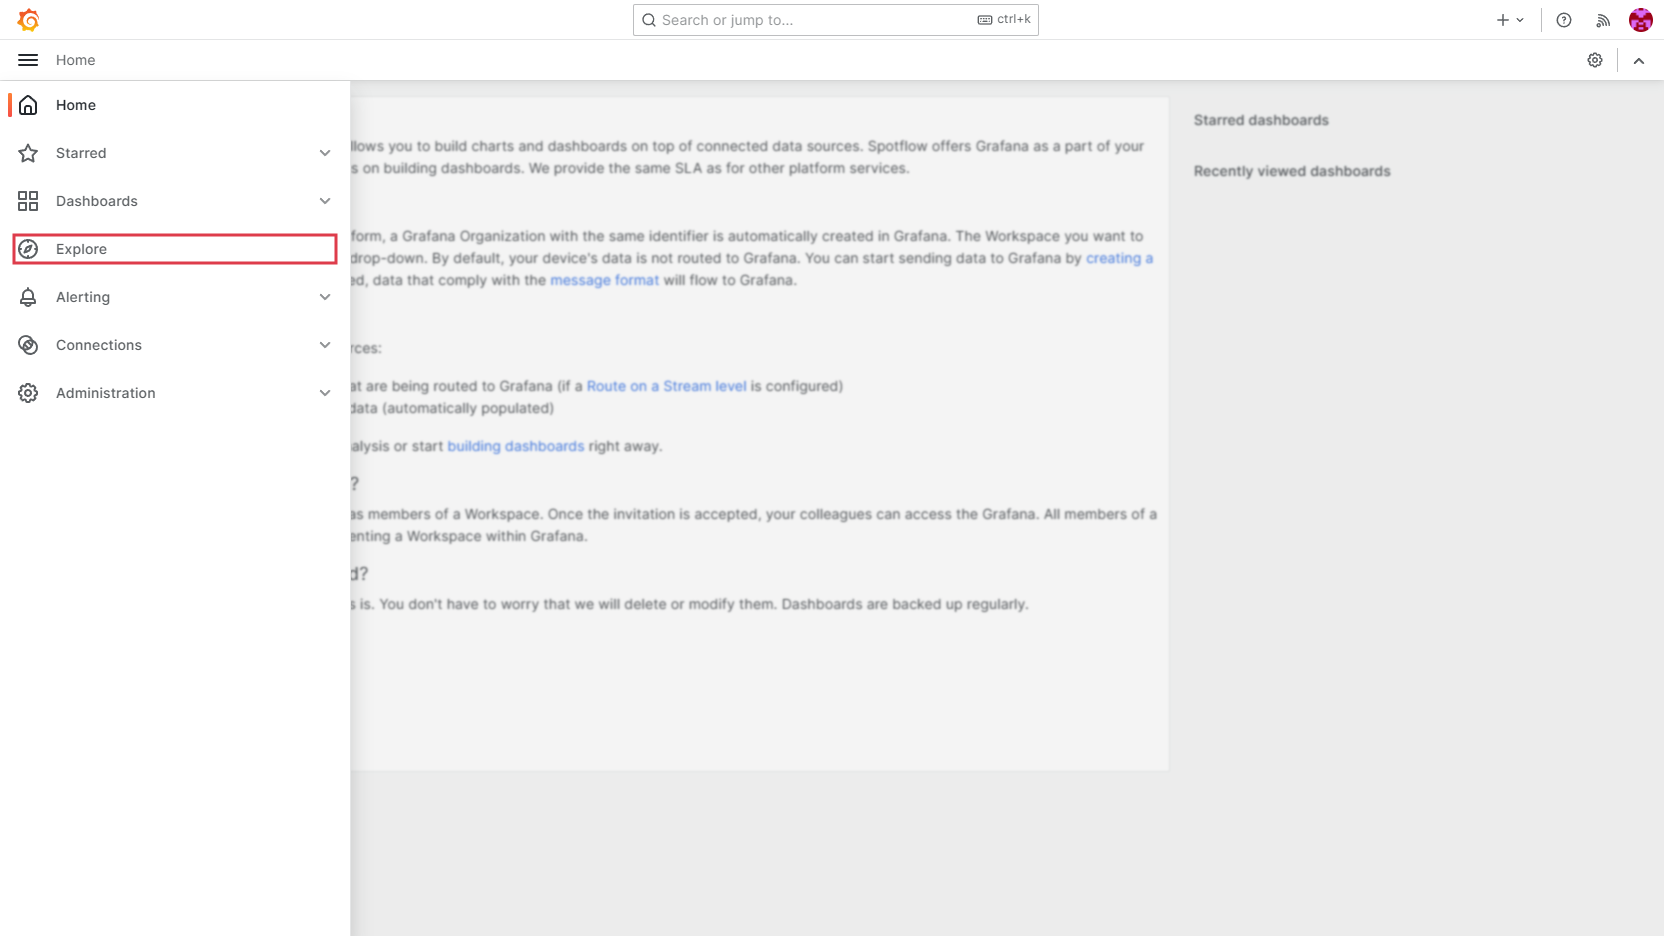
Open the link Explore in the menu.
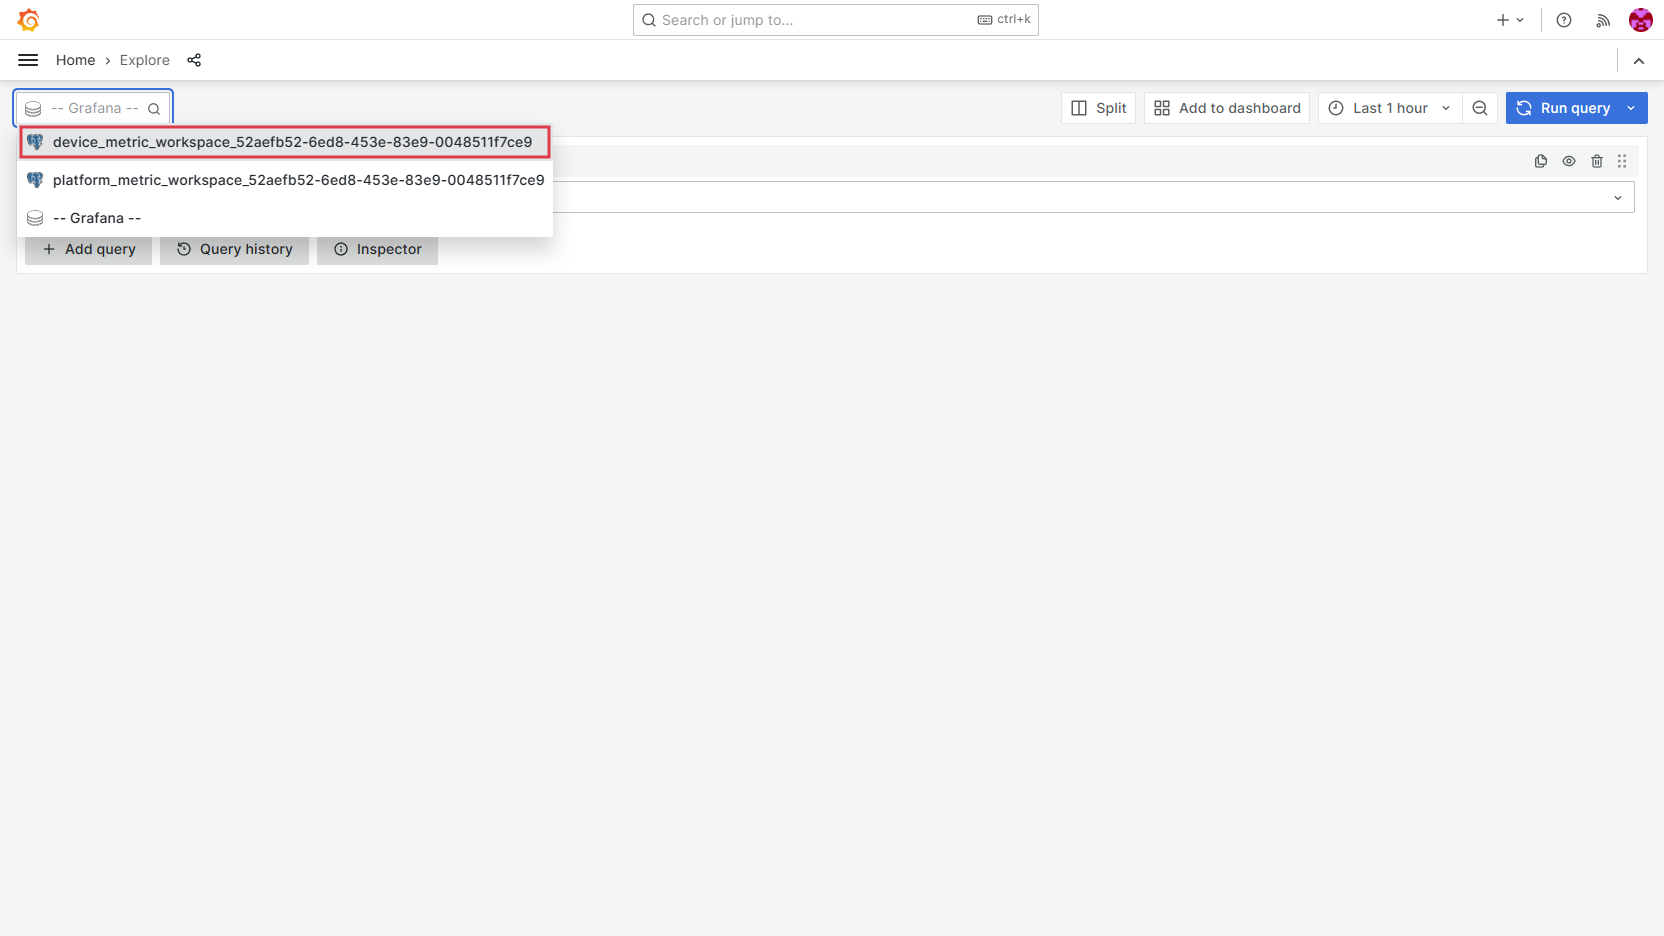
In the query editor, open the data-source picker.
Select the data source that starts with
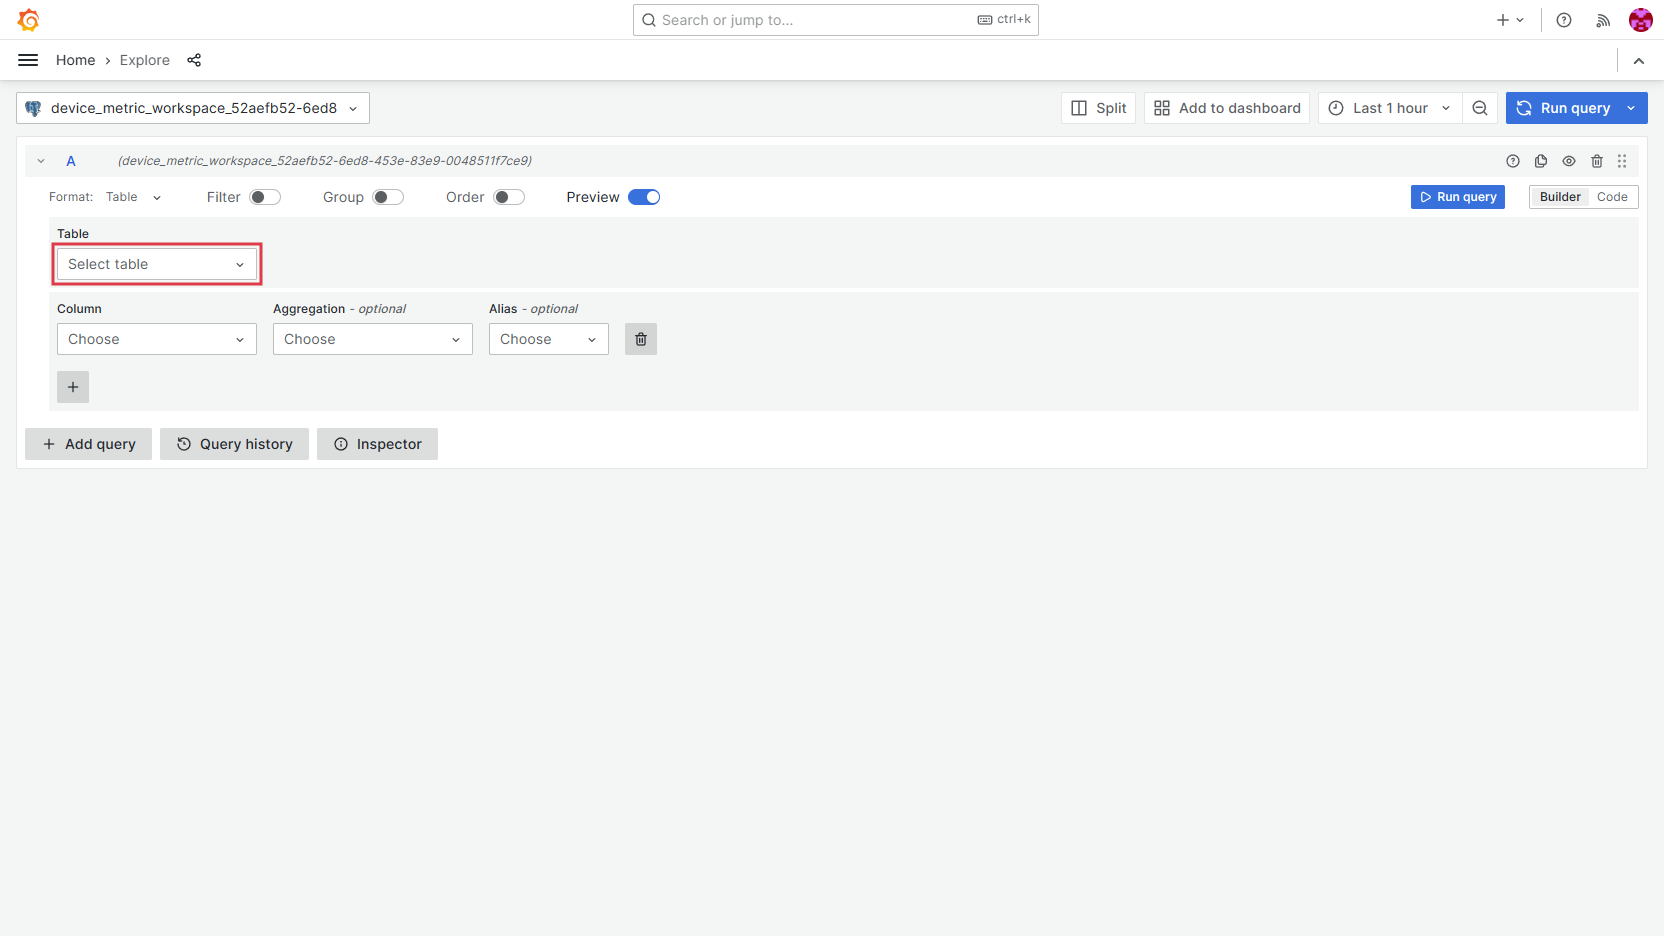
device_metric. The other one contains the usage data of your Workspace.Click Select table.
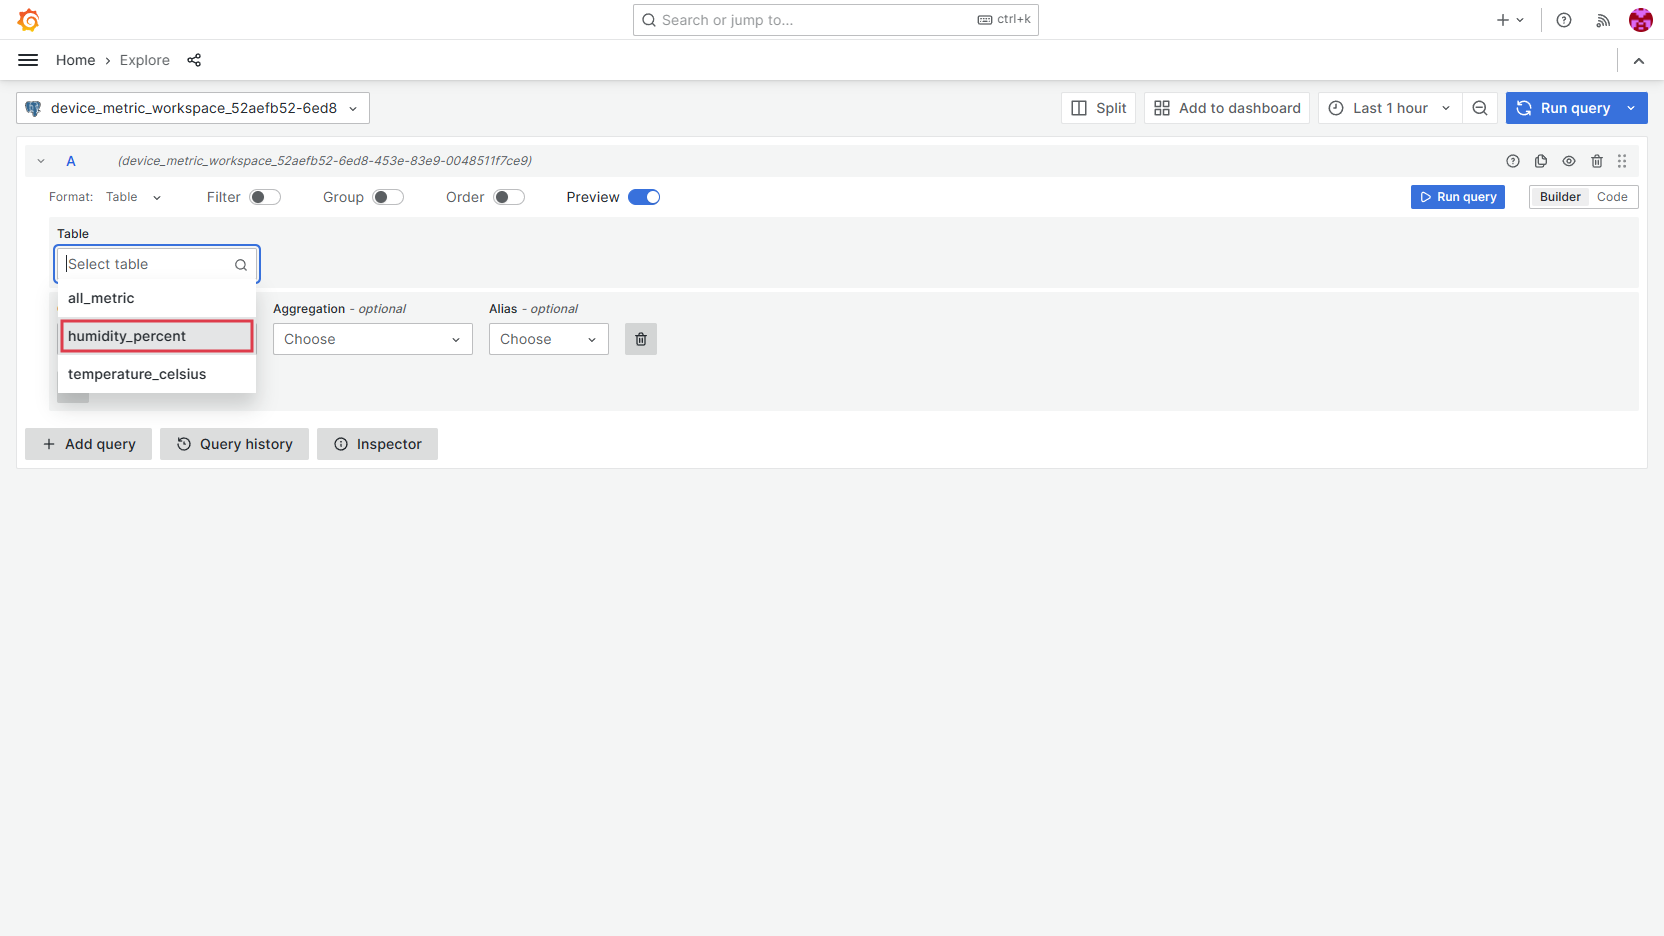
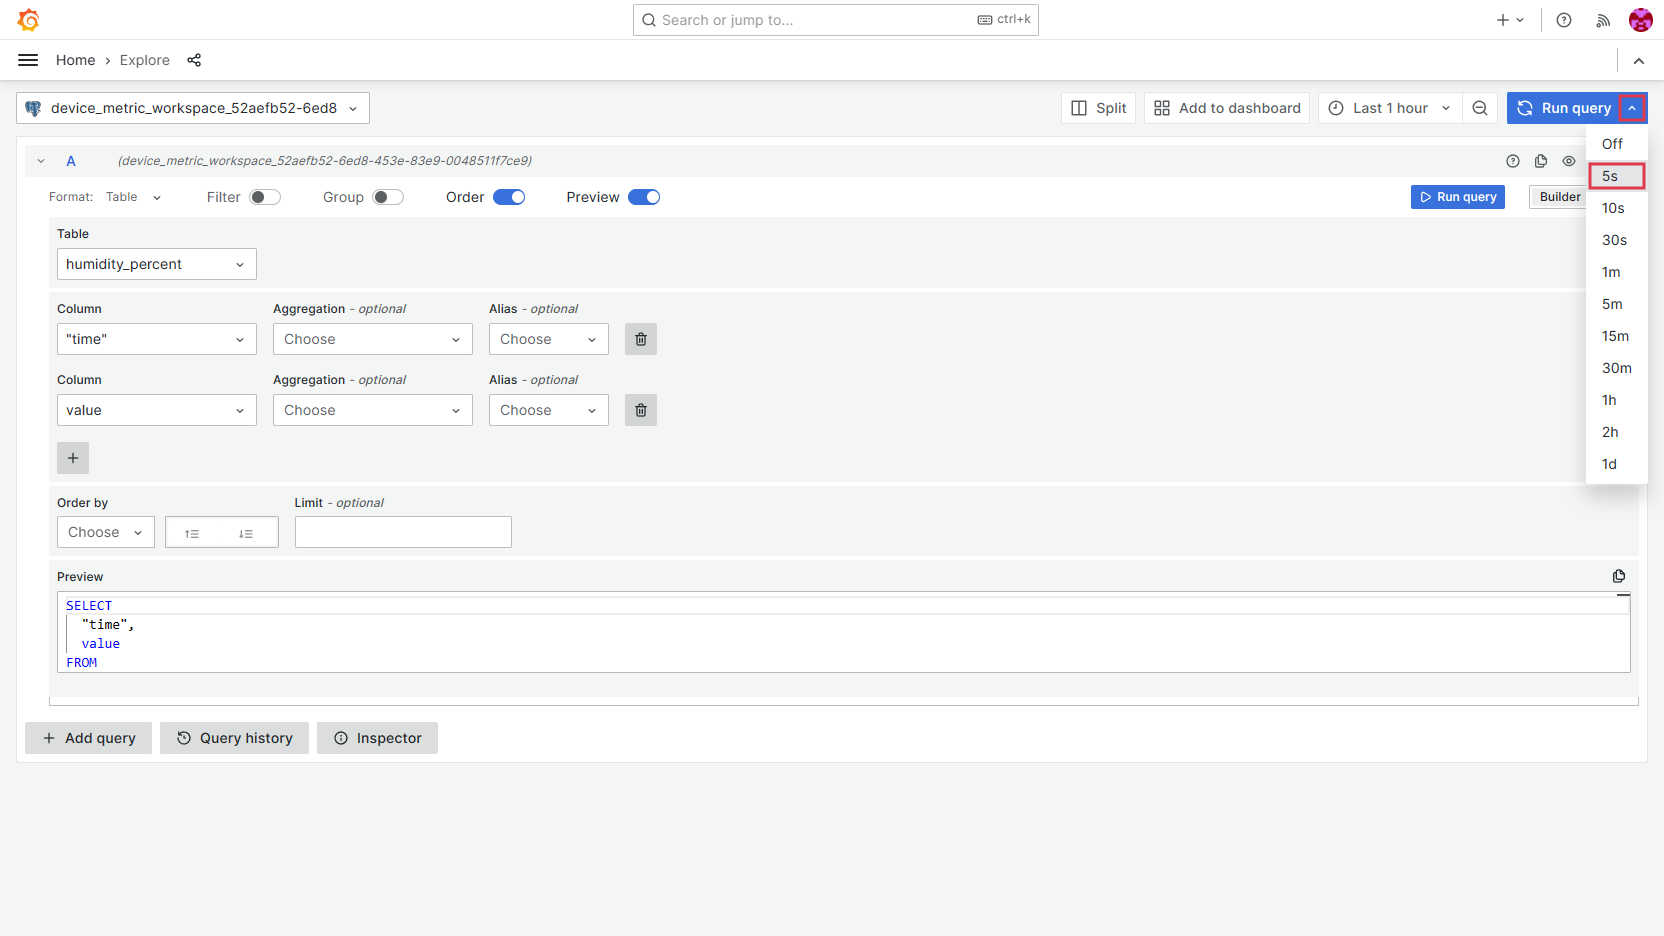
The Platform creates a new table from each metric it receives in any Message. It also changes the name of the metric into the snake case. Select
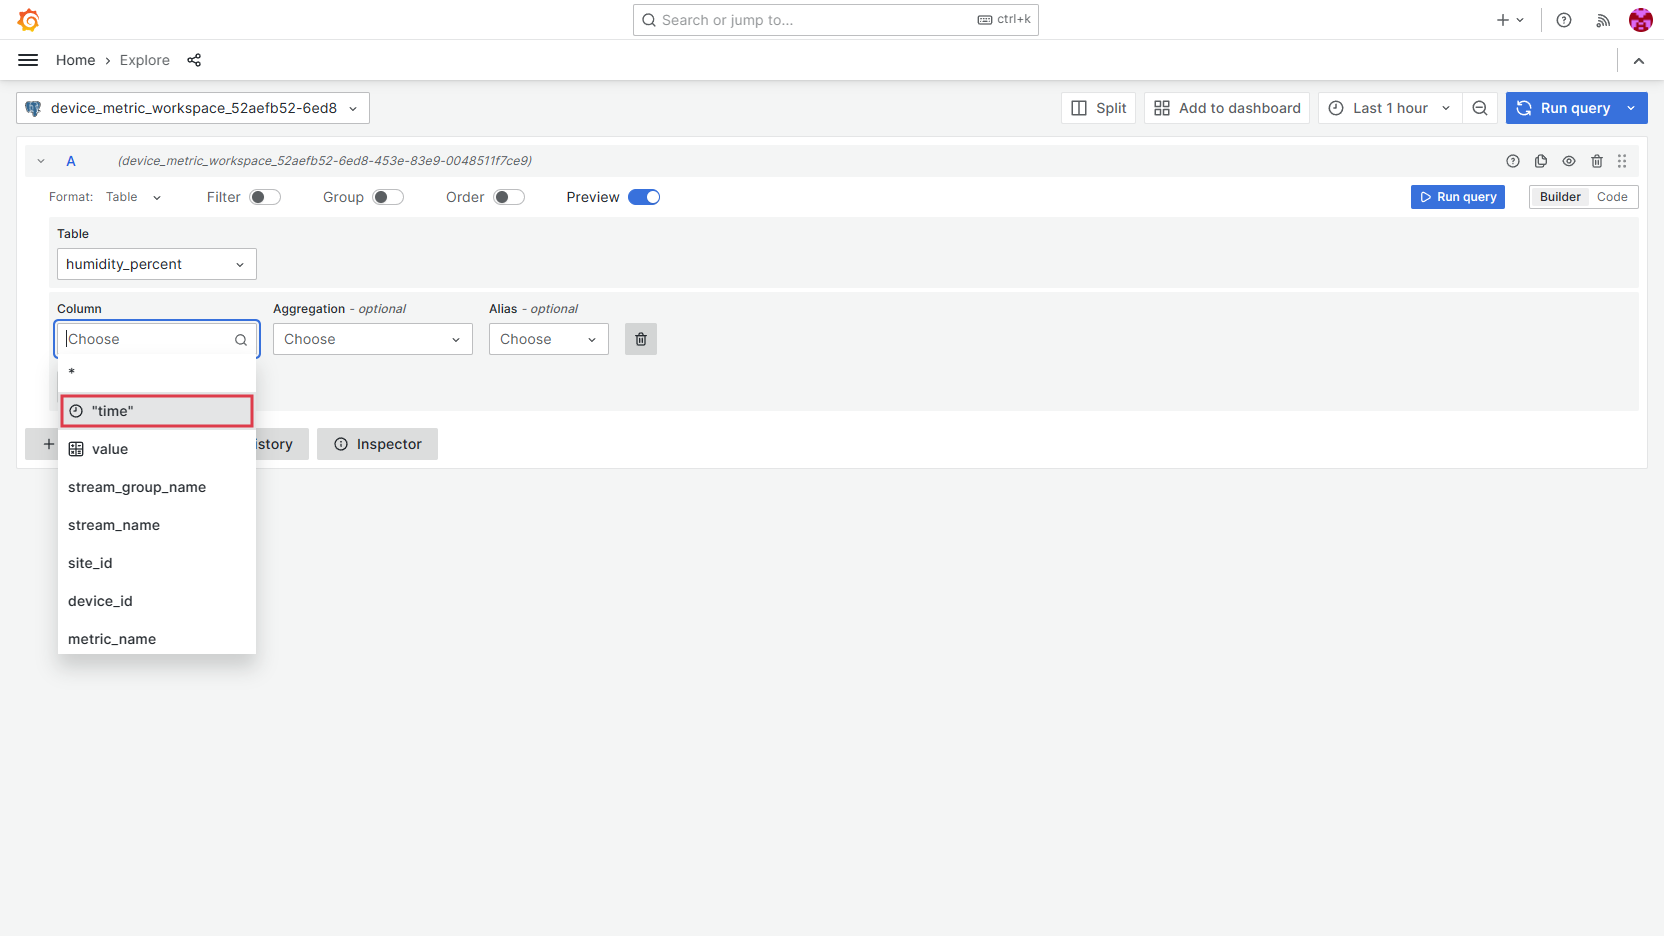
humidity_percent.Because we want to know when the Device took the measurement, select the
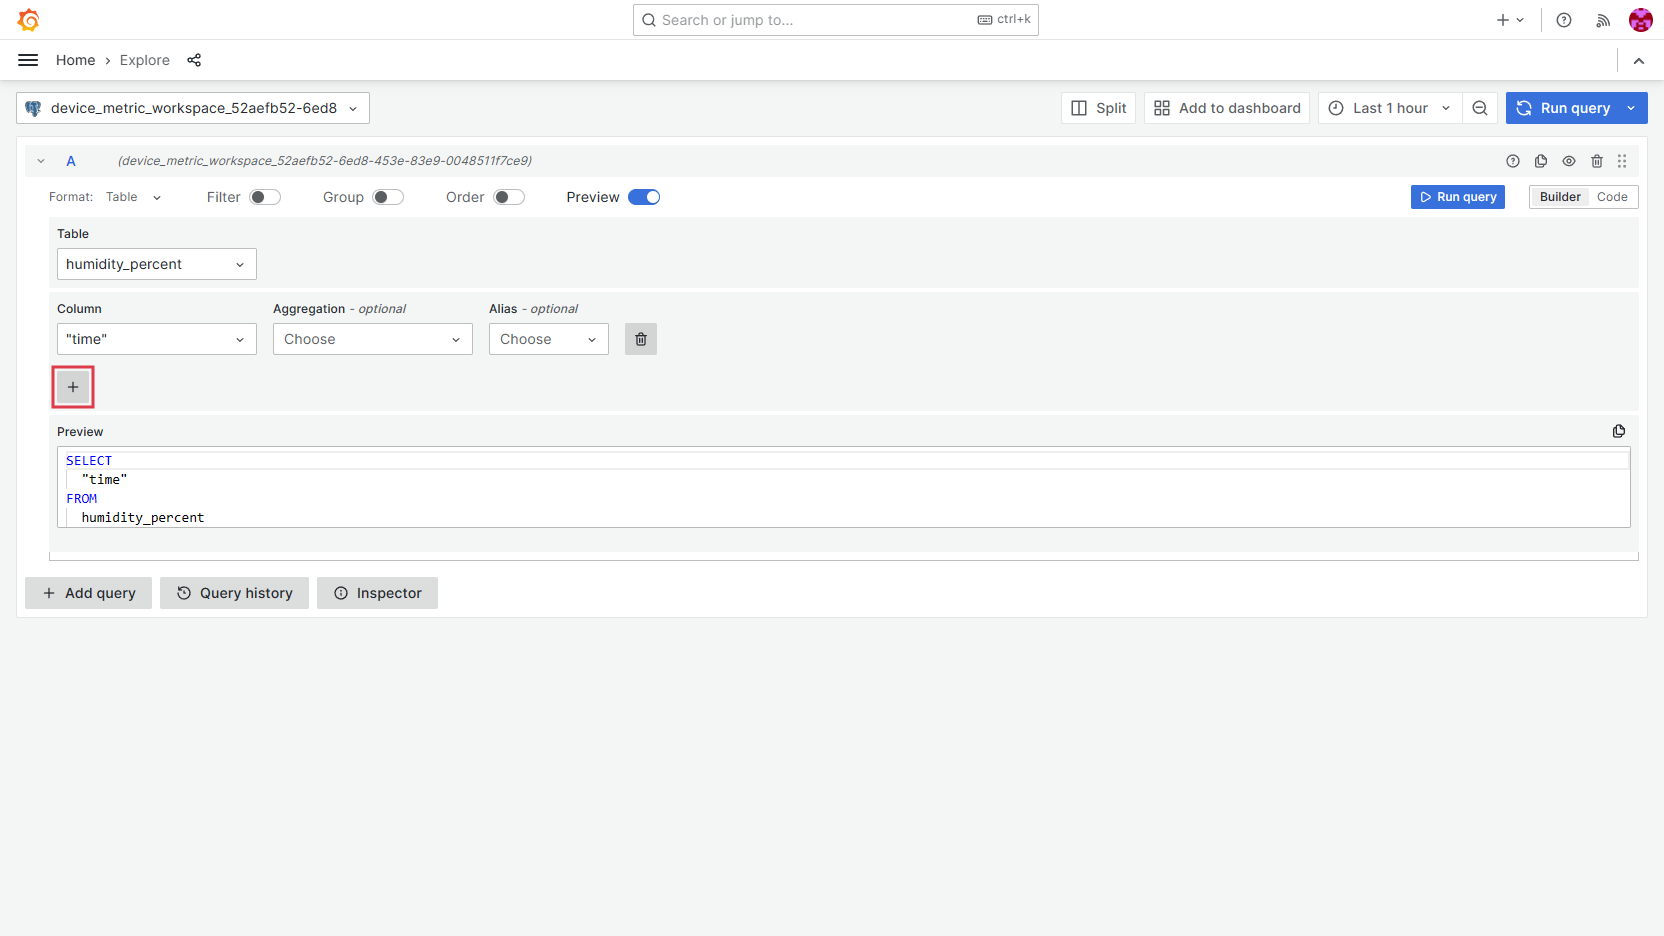
"time"Column.Click the + button to add another column.
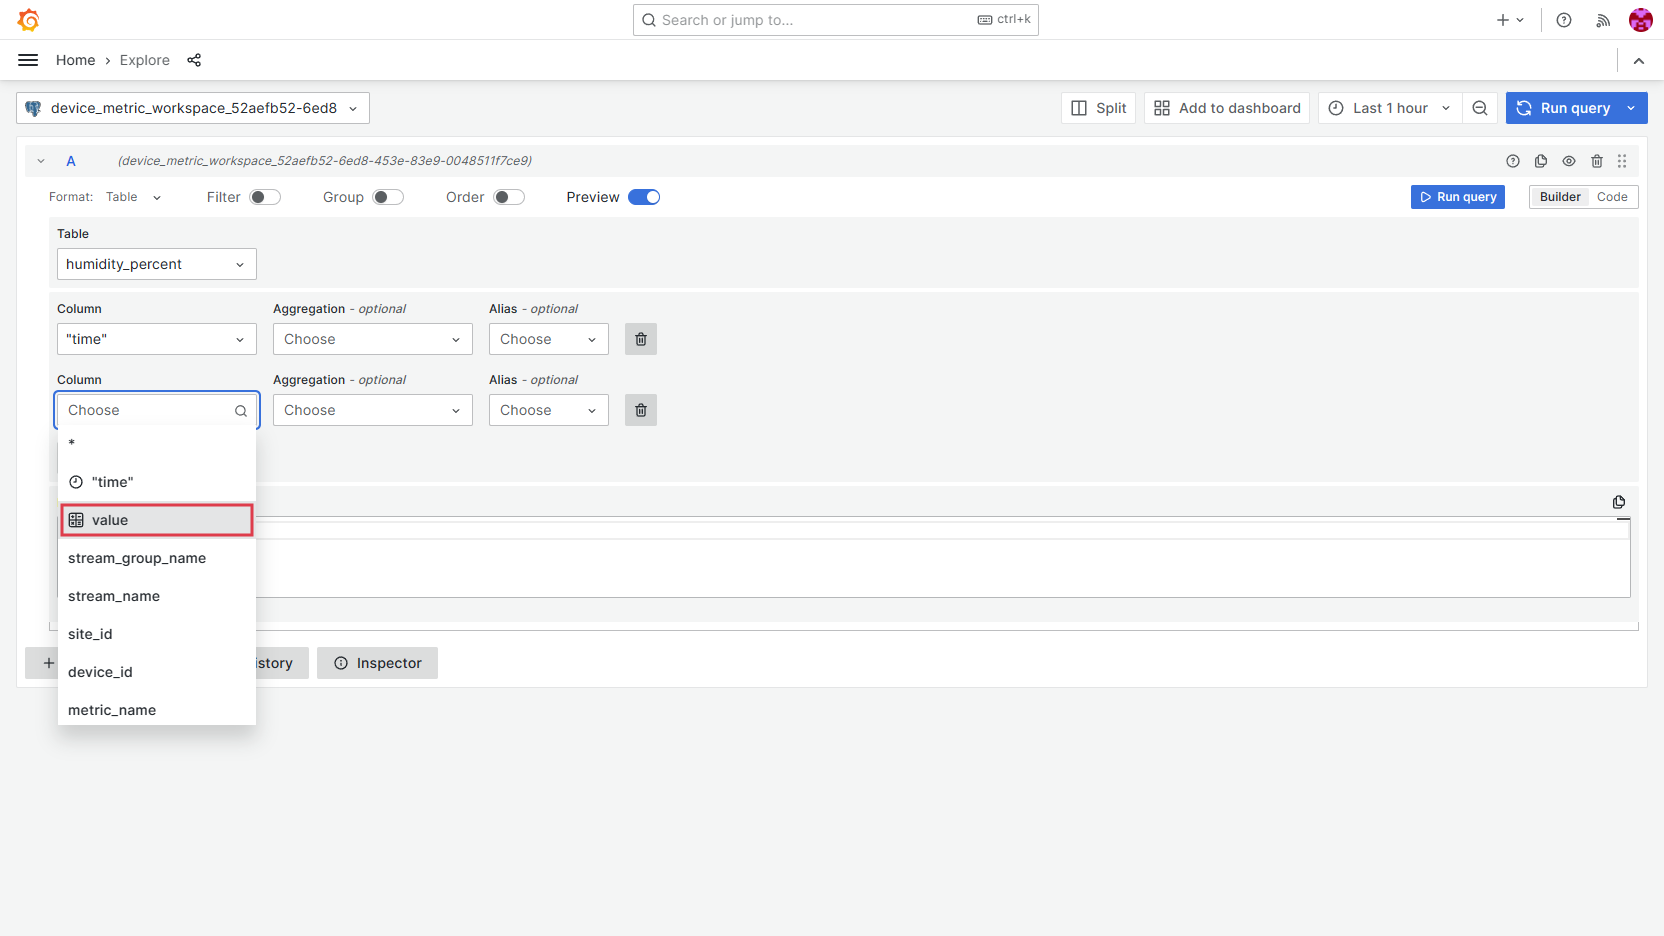
Choose the second column. Select
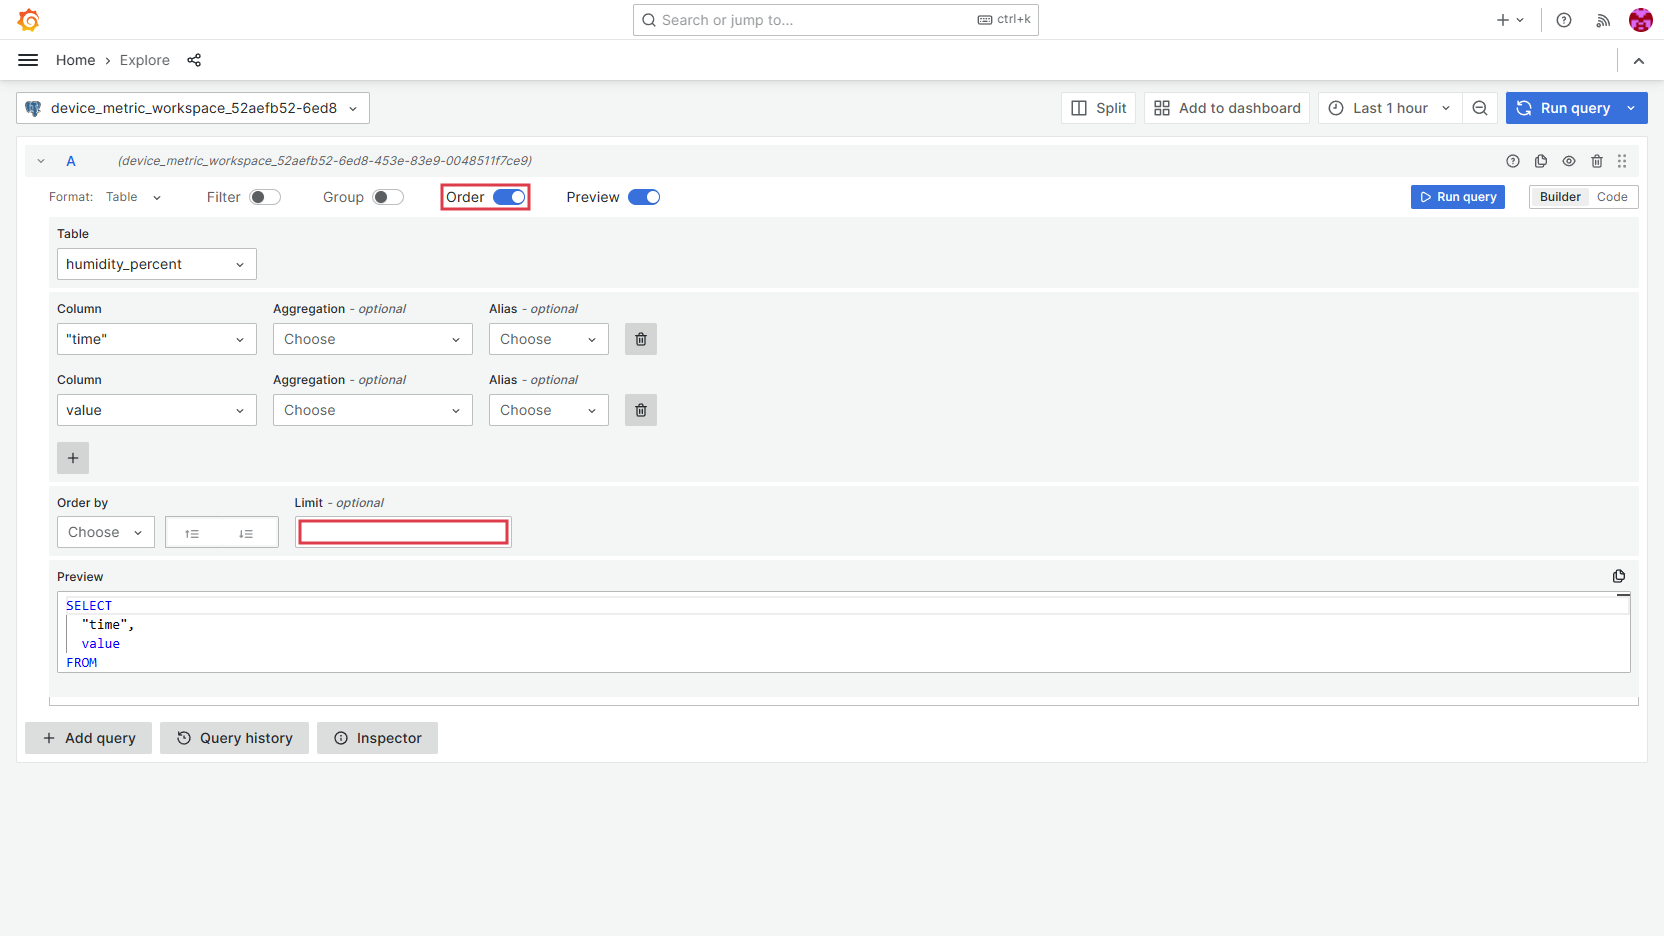
value.Grafana shows only the last 50 records by default. To change this, click Order and erase the Limit.
Expand the options of the big Run query button in the top-right corner. Select 5s to automatically refresh the query every 5 seconds.
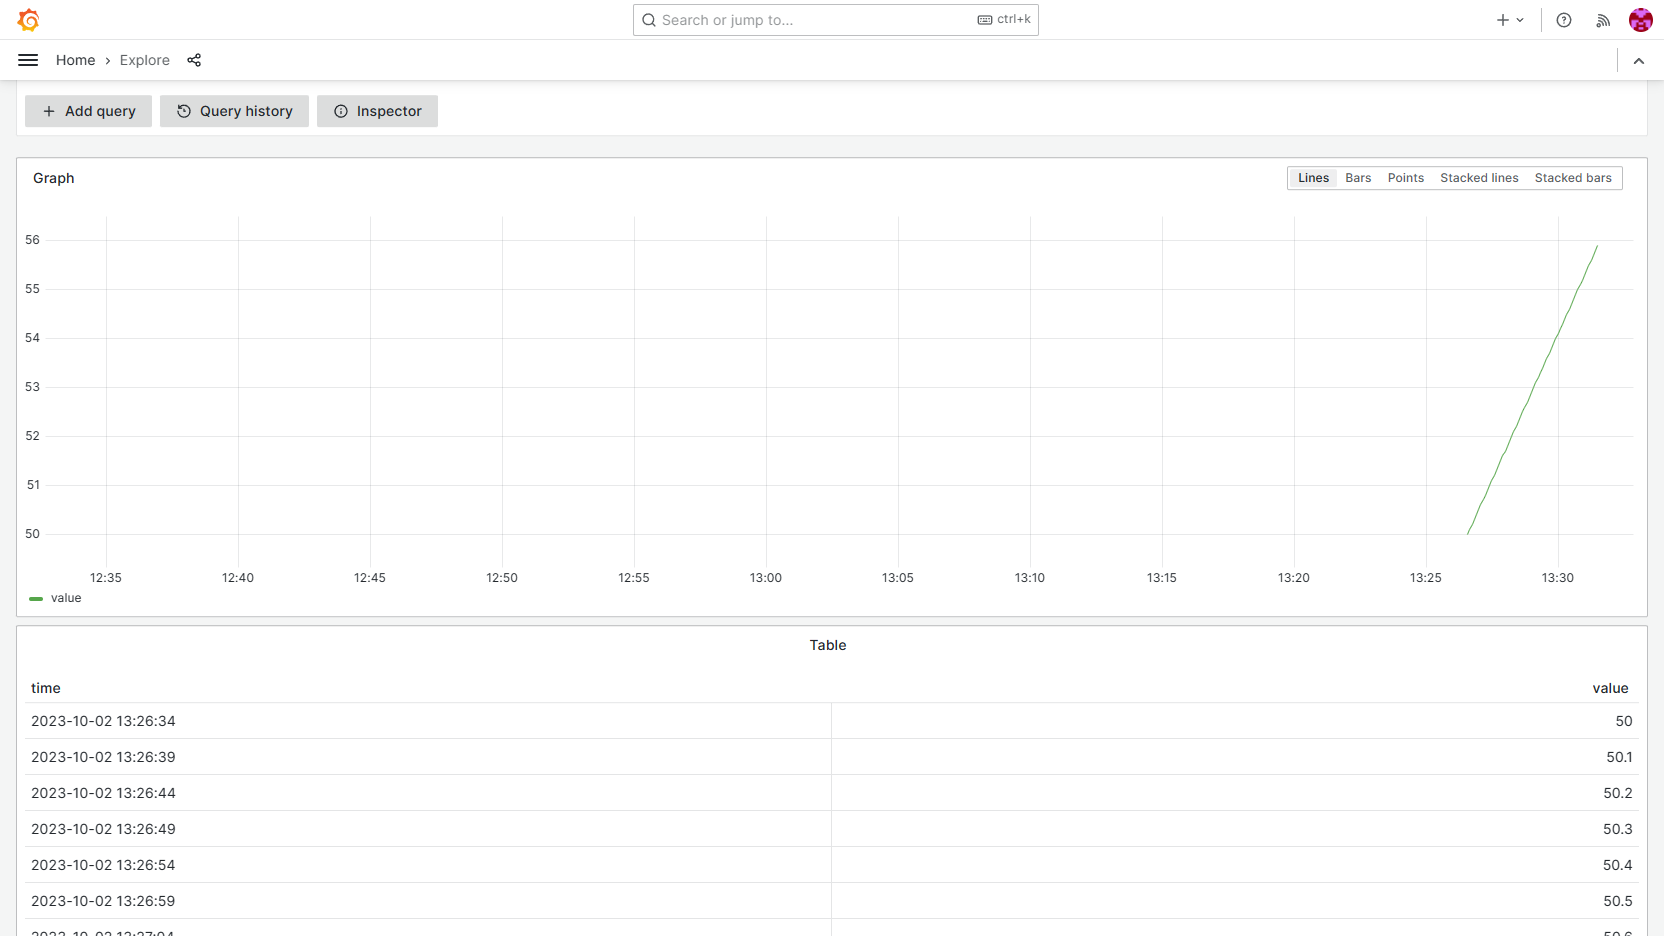
Scroll down to the query results. If the Device is still sending Messages, you'll see them appearing as rows in the Table and points in the Graph in real time.
If your program finished sending Messages, you can rerun it to see the data appearing in Grafana. You don't need to approve the Device this time because it's already registered.
What's next
- Feel free to explore the received data and create custom dashboards, as described in the official Grafana documentation.
- To learn more about the integrated instance of Grafana and the format it accepts, see the User Guide.
- To develop custom streaming applications, look at Egress Sinks.