Tutorial: Send Telemetry from Teltonika RUTX Router
This tutorial will show you how to:
- Install and configure the official Spotflow package on a Teltonika RUTX router.
- Visualize the telemetry data in the integrated instance of Grafana.
- Replace the sample service from the package with a custom Rust application that uses the Spotflow Device SDK.

The package consists of the following components:
- Configuration: A set of configuration options stored in
/etc/config/spotflow. - Sample application: An executable that receives all the necessary configuration options as command-line arguments. It's responsible for maintaining the connection to the Spotflow IoT Platform and sending telemetry data.
- Background service: A service that runs the sample application in the background.
It's configured in the file
/etc/init.d/spotflow. Changing configuration options in the WebUI will update the configuration file and restart the background service.
The first three sections of this tutorial show how to use the package and platform to visualize the router's resource usage in Grafana. The last two sections demonstrate how to replace the sample application with your custom one.
Requirements
- Teltonika RUTX router (tested with RUTX50)
- If you are not registered to the Spotflow IoT Platform yet, Sign Up.
- You need to have an existing Stream.
A stream called
default-streamin stream groupdefault-stream-groupis created automatically after you register. Create a new one if you want to use a different stream. - You need to have an existing provisioning token.
- To compile and deploy your custom application, you need a development machine running on Linux, Windows or macOS with the following software:
This tutorial uses Rust for the custom application because the other languages supported by the Spotflow Device SDK are associated with the following caveats:
- C: You need to cross-compile the application for the CPU architecture and operating system used in Teltonika RUTX routers. This process will most likely involve downloading and compiling Teltonika SDK.
- Python: The PyPI package
spotflow-deviceisn't currently compiled for the Python version used in Teltonika RUTX routers. If you need this language for your scenario, consider creating a feature request on the Device SDK GitHub repository.
1. Configure Route to Spotflow Grafana
The Start Workspace, created when you registered, already contains an egress route to the Spotflow Grafana. If you're using a different workspace, you must create the egress route manually.
2. Install and Configure Spotflow Package
In order to install the Spotflow package on the Teltonika RUTX router, you need to access the command line interface of the router. See the Teltonika Wiki for the recommended approach according to your operating system:
Log in to the router and run the following commands to download and install the package:
curl -O https://downloads.spotflow.io/device-sdk/teltonika-rutx/latest/spotflow-service.ipk
opkg install spotflow-service.ipk
After opkg confirms the installation, configure the package to use the provisioning token you created earlier:
uci set spotflow.iotplatform.provisioning_token=<Your Provisioning Token>
uci set spotflow.iotplatform.device_id=my-device
uci set spotflow.iotplatform.enabled=1
uci commit spotflow
The router's serial number is used as the device ID by default. If you want to keep it, you can skip the second command (highlighted).
Start the service in the background using the following command:
/etc/init.d/spotflow start
After you approve the device to the Spotflow IoT Platform (see Approve Device), the service will start sending telemetry.
If you want to see the output of the service, open another instance of the router's command line and run logread -f.
This command will show you the logs of background services in real-time.
You can exit the log view by pressing Ctrl+C.
3. Visualize Data in Spotflow Grafana
Download this JSON file which contains the definition of a custom dashboard for the telemetry data. Then, follow these steps:
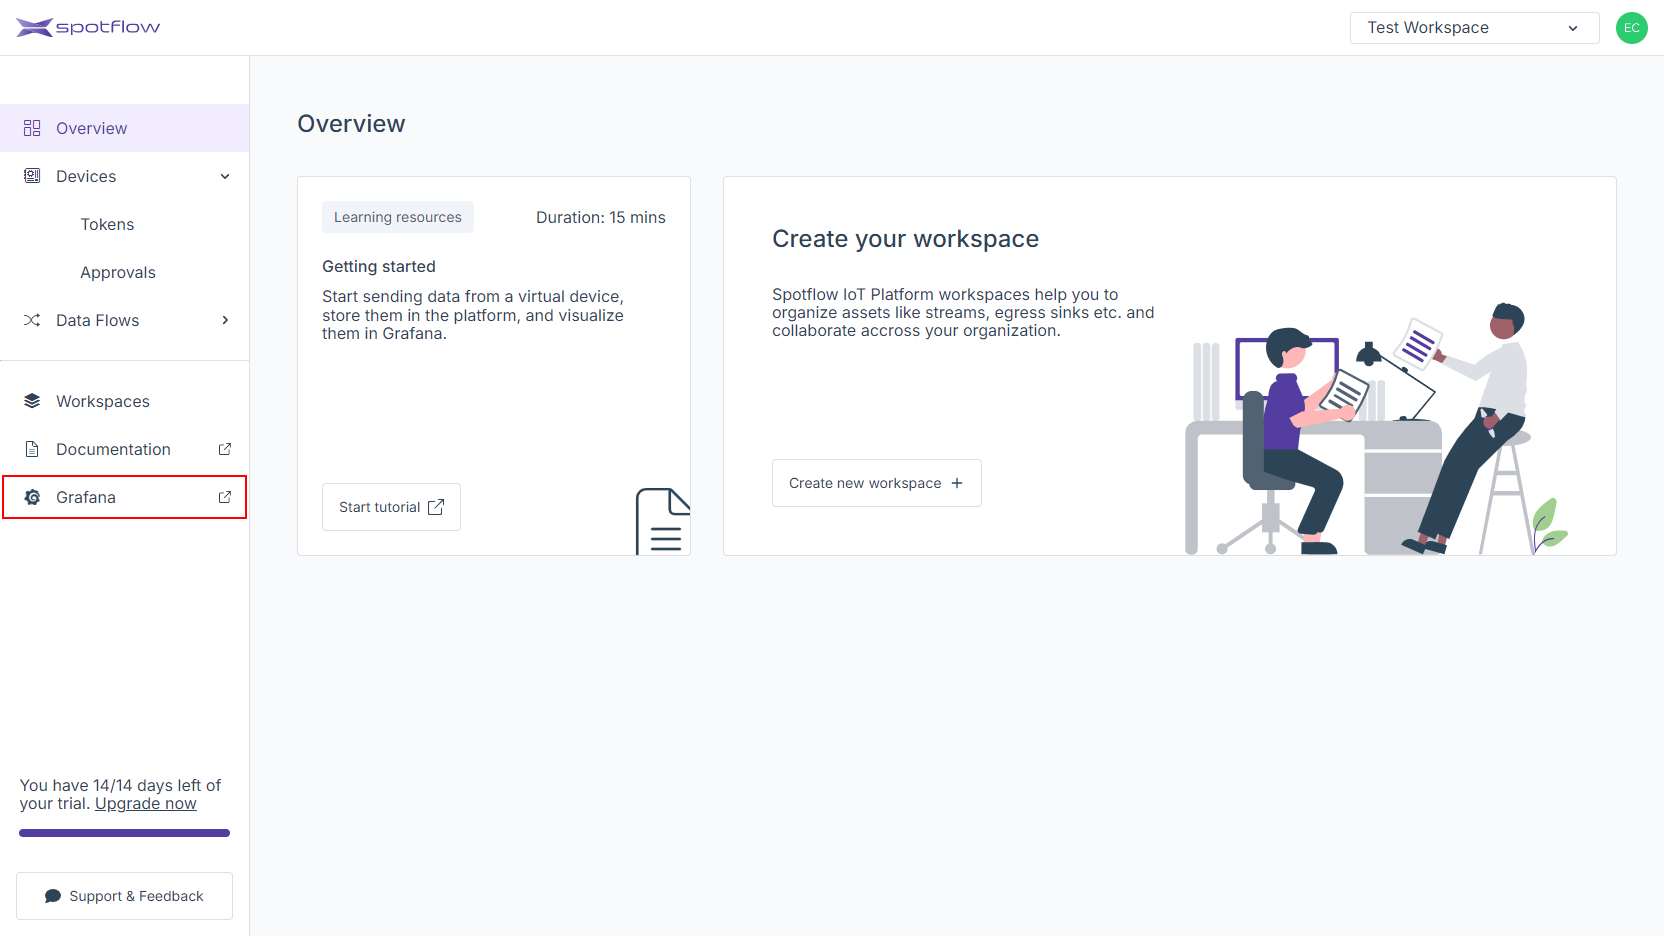
Open the link Grafana in the left sidebar.
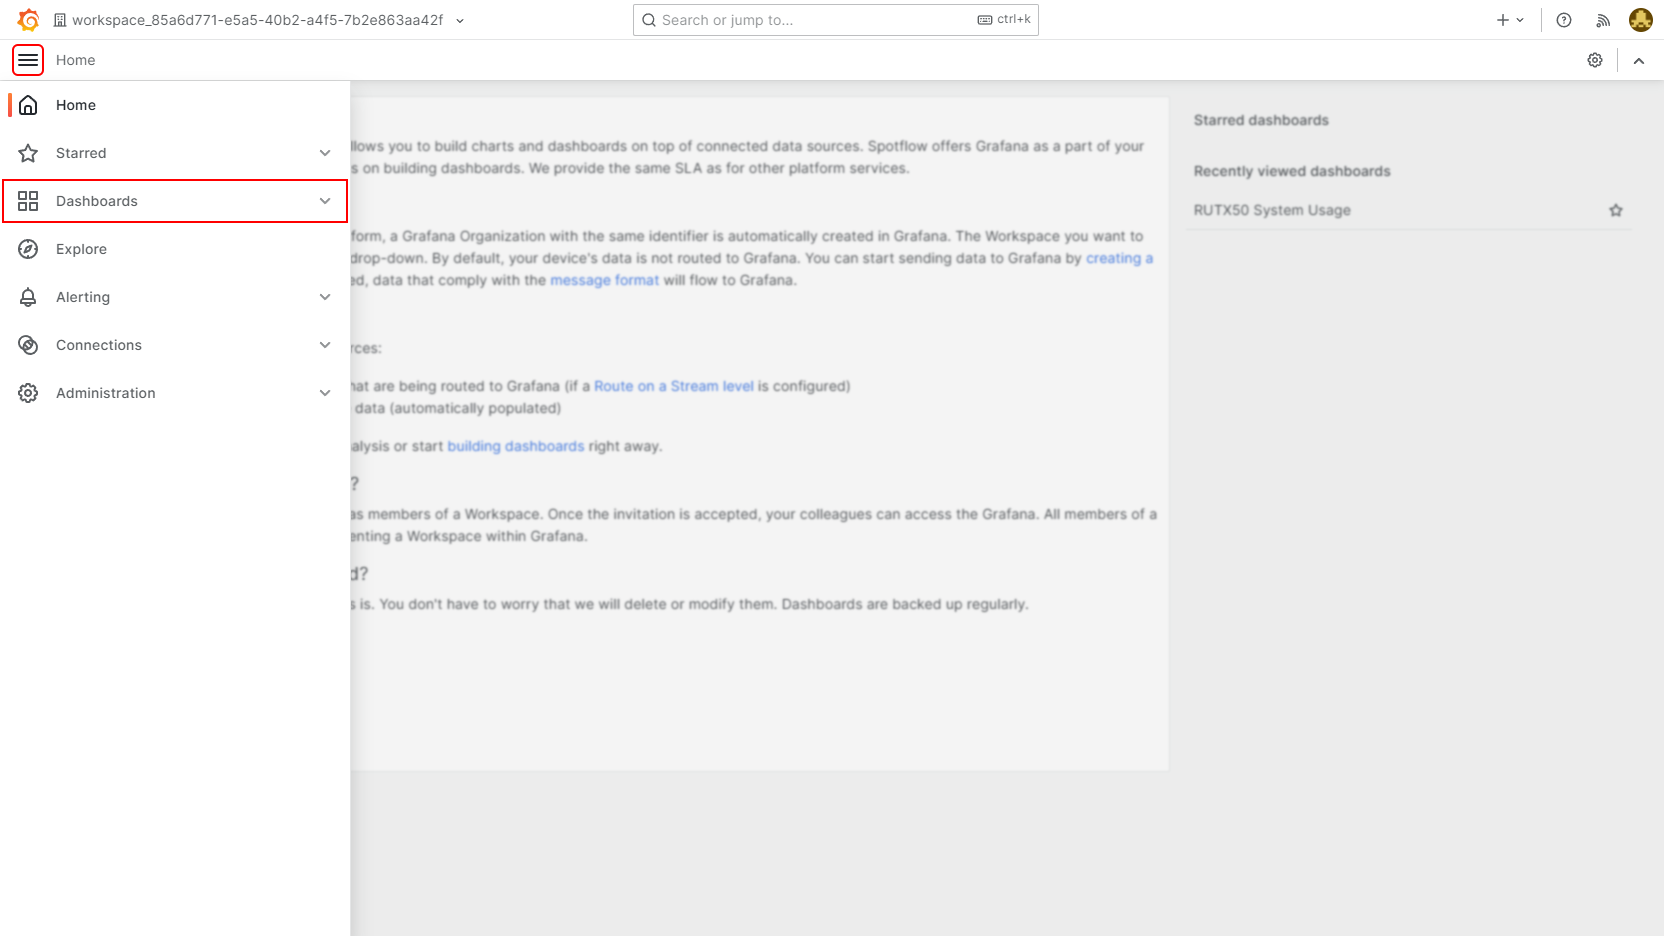
The instance of Grafana integrated into the Spotflow IoT Platform should open in a new tab. Navigate to the Dashboards section.
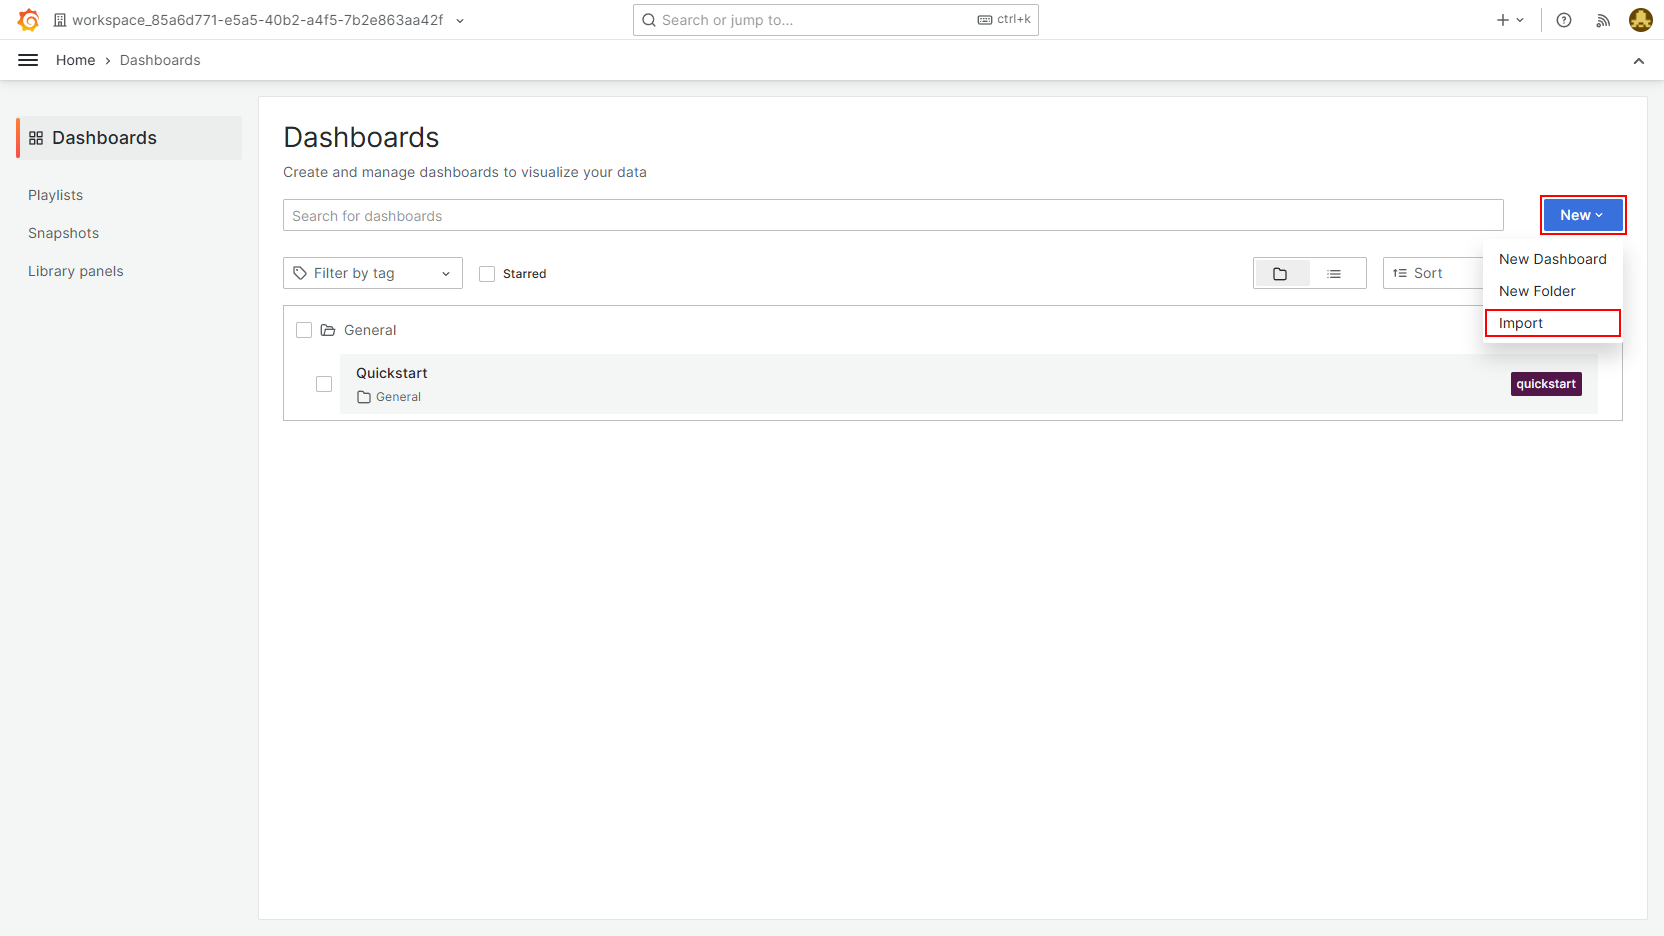
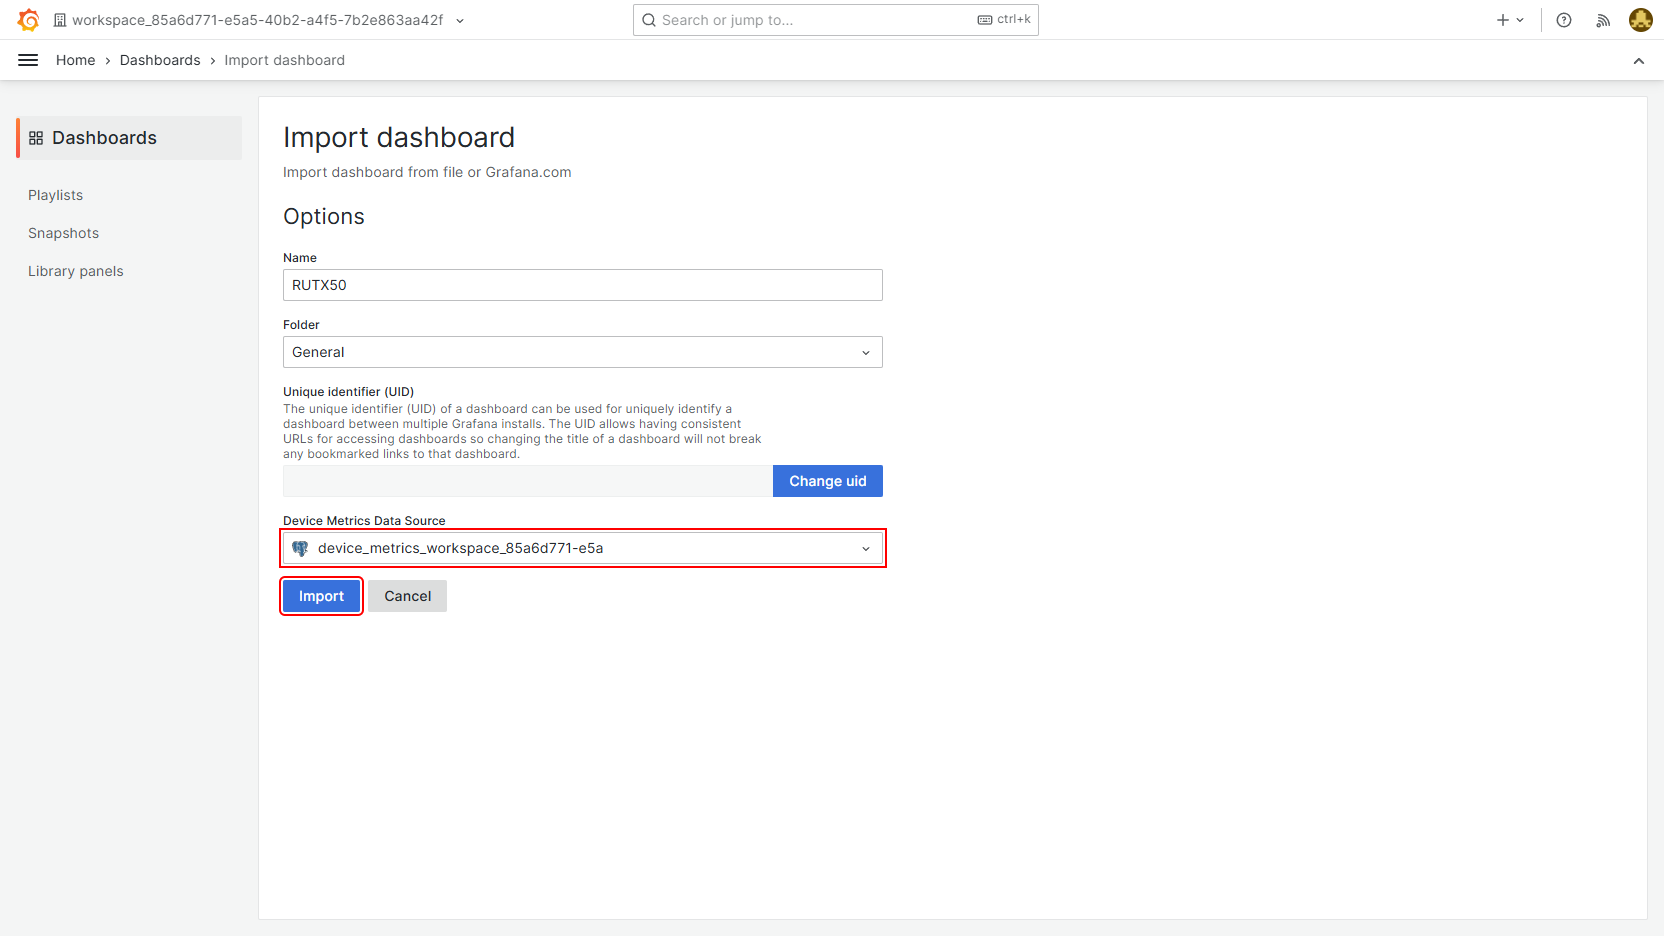
Click New and select Import in the drop-down menu.
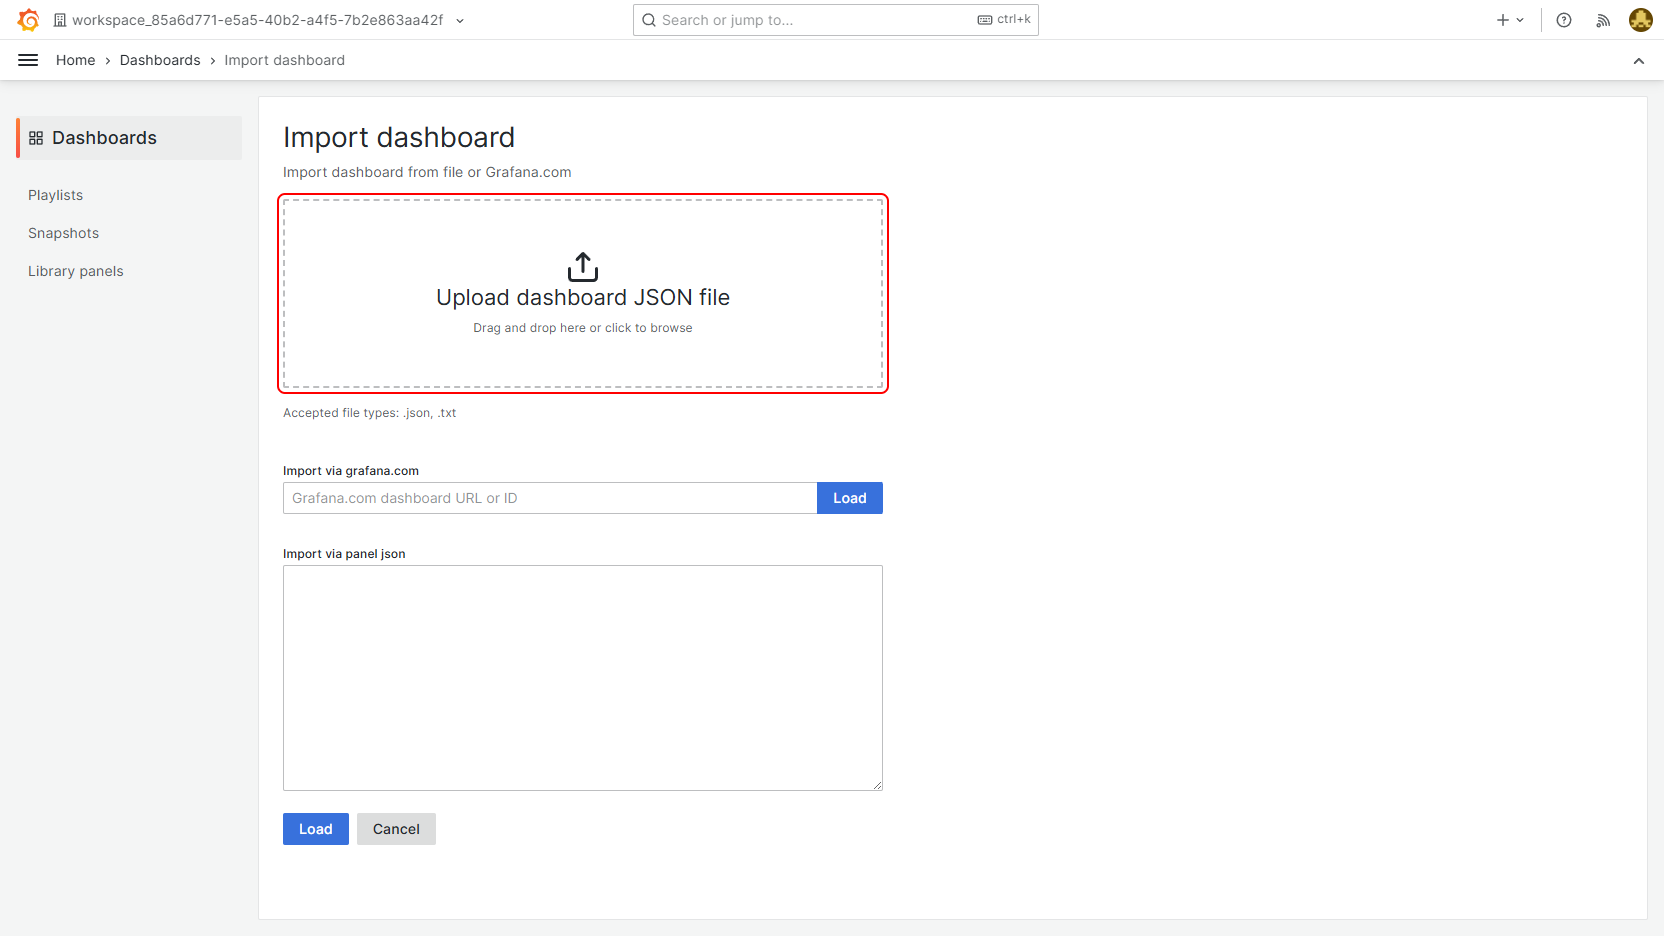
Upload the JSOn file using the large button.
Select the data source
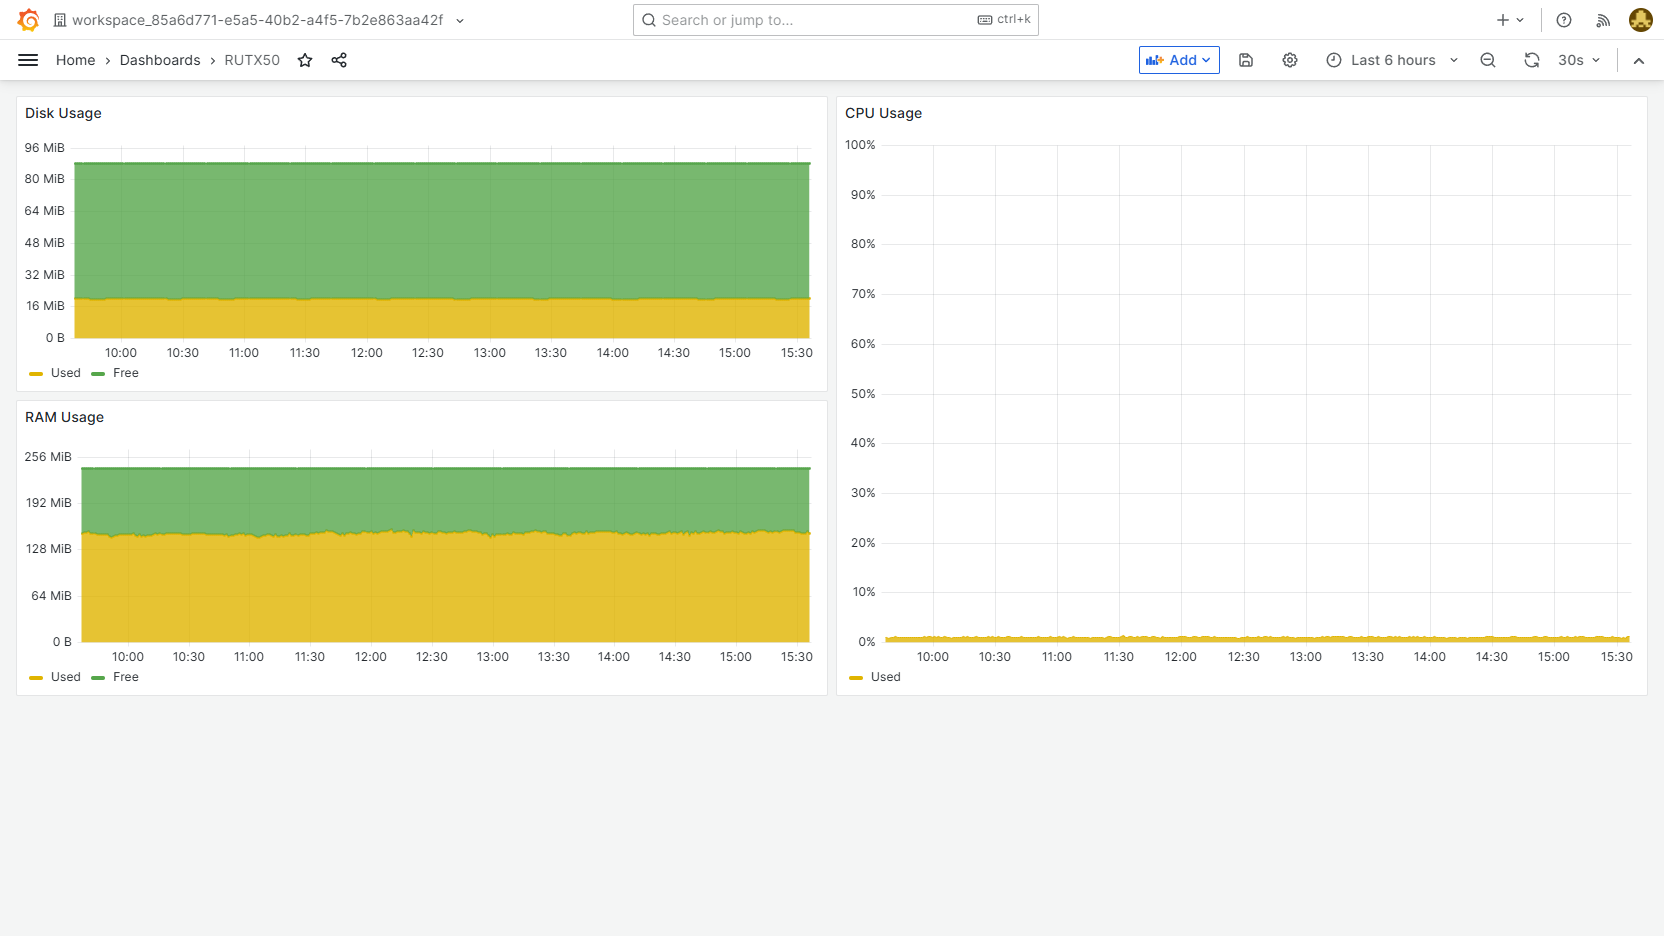
device_metrics_workspace_<Your Workspace ID>from the list of available data sources and click ImportFinally, the dashboard with the telemetry data should appear.
If Grafana shows Page not found right after the import, refreshing the page should help.
4. Build Custom Application
If you want to use a different programming language than Rust, see the Requirements section for the caveats associated with C and Python. Regardless of the language, the application must accept the same command-line arguments as the one described in this section.
For real-world use cases, you'll want to replace the sample application with your own. Run these commands on your development machine to create a new Rust project with the necessary dependencies:
cargo new custom_service --bin
cd custom_service
cargo add chrono env_logger serde_json sysinfo
cargo add spotflow --features=openssl-vendored
Replace the contents of custom_service/src/main.rs with the following code (download):
use std::env;

use serde_json::json;
use spotflow::{DeviceClientBuilder, MessageContext};
use sysinfo::{Disks, System};

fn main() {
    if env::args().len() != 5 {
        eprintln!("Usage: custom_service <Instance> <Device ID> <Provisioning Token> <Local DB File Path>");
        std::process::exit(1);
    }

    println!("Starting the custom service for the communication with the Spotflow IoT Platform.");

    let instance = env::args().nth(1).unwrap();
    let device_id = env::args().nth(2).unwrap();
    let provisioning_token = env::args().nth(3).unwrap();
    let database_file = env::args().nth(4).unwrap();

    // Enable logging
    env_logger::Builder::from_env(
        env_logger::Env::default()
            .default_filter_or("sqlx=warn,ureq=warn,rumqtt=warn,ingress=info,spotflow=info,info"),
    )
    .init();

    // Connect to the Platform (starts Device Provisioning if the Device is not already registered)
    let client = DeviceClientBuilder::new(Some(device_id), provisioning_token, database_file)
        .with_instance(instance)
        .build()
        .expect("Unable to build connection to the Platform");

    // Create a Message context to send Messages to the default Stream of the default Stream Group
    let message_context = MessageContext::new(
        Some(String::from("default-stream-group")),
        Some(String::from("default-stream")),
    );

    // Initialize the holder of the system information
    let mut system = System::new();

    loop {
        // Send the system information to the platform:

        system.refresh_cpu_usage();
        system.refresh_memory();

        let disks = Disks::new_with_refreshed_list();
        let disk = disks
            .iter()
            .find(|d| d.mount_point().as_os_str() == "/")
            .unwrap();

        let payload = json!({
            "timestamp": chrono::offset::Utc::now().to_rfc3339(),
            "cpuUsagePercent": system.global_cpu_usage(),
            "memoryFreeBytes": system.total_memory() - system.used_memory(),
            "memoryUsedBytes": system.used_memory(),
            "diskFreeBytes": disk.available_space(),
            "diskUsedBytes": disk.total_space() - disk.available_space(),
        })
        .to_string();

        client
            .enqueue_message(&message_context, None, None, payload.clone().into_bytes())
            .expect("Unable to send message");

        println!("{payload}");

        // Pause till next iteration
        std::thread::sleep(std::time::Duration::from_secs(60));
    }
}
The application uses the Device SDK to connect to the Spotflow IoT Platform using the provided unique device ID and the provisioning token.
Then, it acquires the usage of system resources using the sysinfo crate and sends this data to the Platform periodically.
This tutorial uses cross to compile the application for the processor and operating system used in Teltonika RUTX routers.
Create a new file called Cross.toml in the project folder custom_service with the following content (download):
[target.armv7-unknown-linux-musleabihf]
pre-build = [
    "apt-get update && apt-get install --assume-yes libssl-dev"
]
This configuration file ensures that cross will install the necessary dependencies during compilation.
Finally, build the application with the following command:
cross build --release --target armv7-unknown-linux-musleabihf
The build may take a while because cross needs to download the target armv7-unknown-linux-musleabihf and compile all dependencies such as OpenSSL.
Eventually, it compiles the application into the single file custom_service/target/armv7-unknown-linux-musleabihf/release/custom_service.
5. Install Custom Application
In order to install the application, you must be able to transfer files to the Teltonika RUTX router and execute commands on its operating system. See the Teltonika Wiki for the recommended approaches according to your operating system:
First, transfer the compiled binary custom_service to a directory of your choice on the Teltonika RUTX router, for example, /root/.
Then, run the following commands on the router to configure the Spotflow application to use the custom service instead of the original one:
# Ensure that the file isn't removed during firmware upgrade
echo "/root/custom_service" >> /etc/sysupgrade.conf

# Set the custom application as the executable
chmod +x /root/custom_service
uci set spotflow.iotplatform.executable="/root/custom_service"
uci commit spotflow
/etc/init.d/spotflow restart
If you run logread -f in a separate terminal before executing the last command, you should see that your custom service is now running:
Mon Oct 21 00:27:59 2024 daemon.info custom_service[6908]: Starting the custom service for the communication with the Spotflow IoT Platform.
Otherwise, the application is the same as the sample service. Therefore, it should re-use the configuration you set up earlier and continue sending telemetry to the Spotflow IoT Platform.