Tutorial: Receive Data in Your Observability Backend
This tutorial will show you how to route data to an observability backend, such as New Relic, Splunk, Grafana Cloud, DataDog, and Honeycomb. You will:
- Create a free Grafana Cloud account in case you don't have any observability backend
- Create an OpenTelemetry Egress Sink
- Configure a Stream to forward data to the Egress Sink
- See data sent by your Device in Grafana Cloud

Requirements
- If you are not registered to the Spotflow IoT Platform yet, Sign Up.
- You need to have an existing Stream.
A Stream called
default-streamin Stream Groupdefault-stream-groupis created automatically after you register. Create a new one if you want to use a different Stream.
1. Create Free Grafana Cloud Account
You can skip this step if you already have an existing observability backend.
There are many options when choosing an observability backend and the decision should be made according to your needs. We have published two blog articles to help you understand the caveats of monitoring and observability in the IoT world:
- A Practical Guide to Monitoring & Observability of IoT Devices
- Scaling IoT Monitoring & Observability Solutions
To give you a quick start, we've created a simple tutorial on how to create a free Grafana Cloud account.
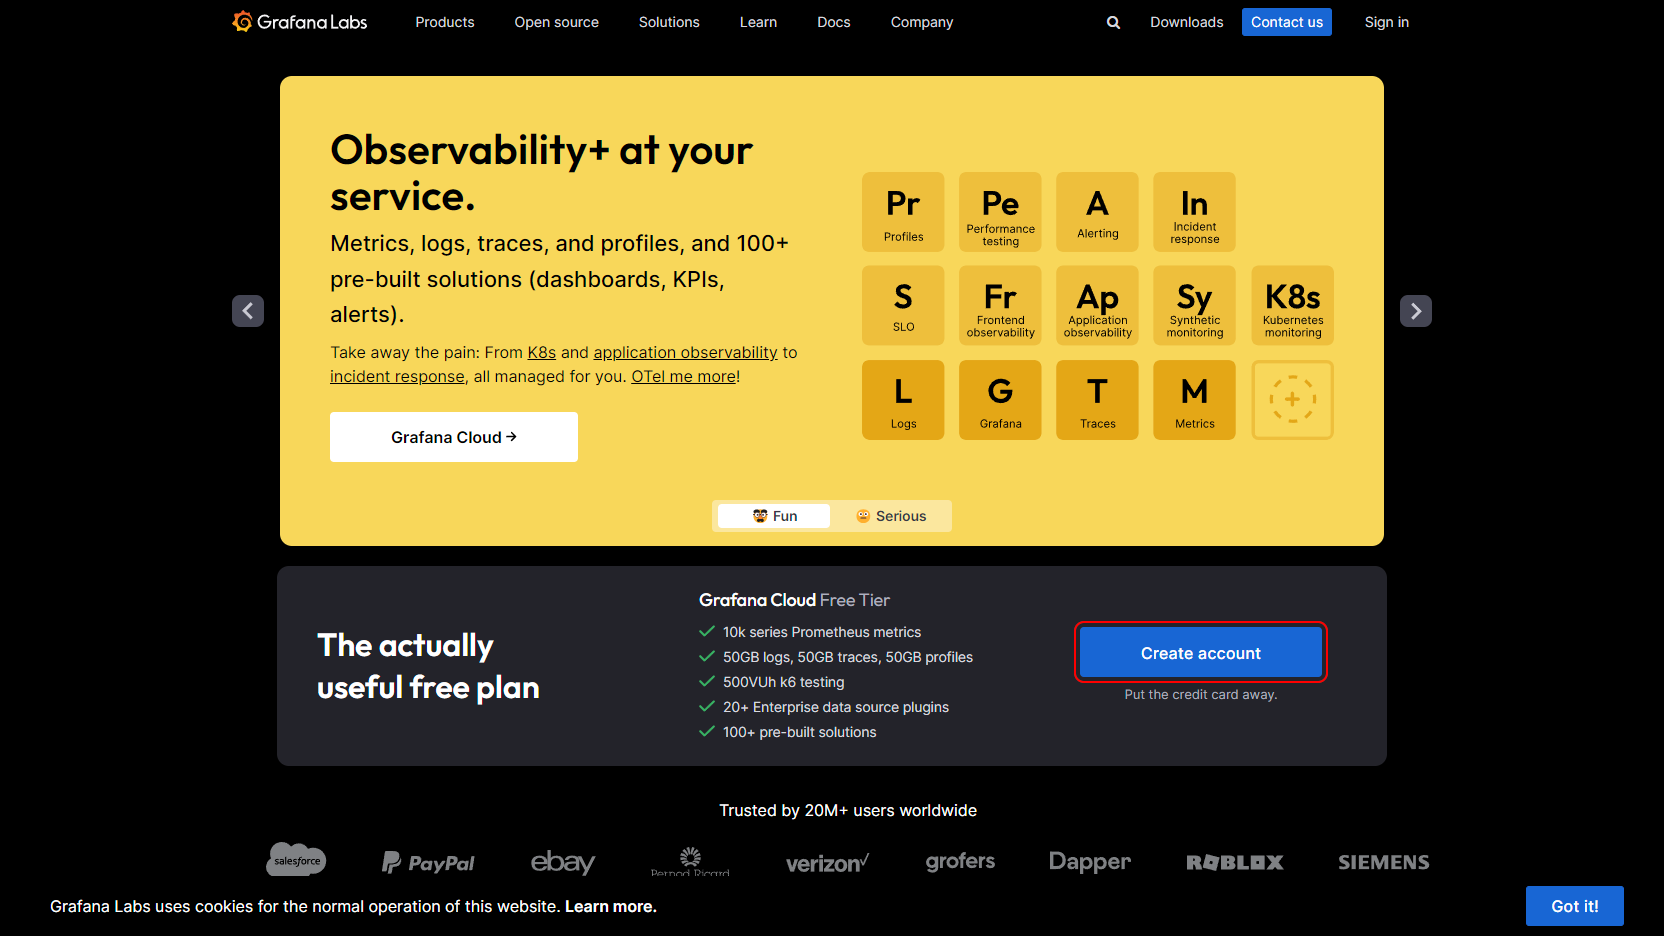

Go to https://grafana.com/ and create a free account.
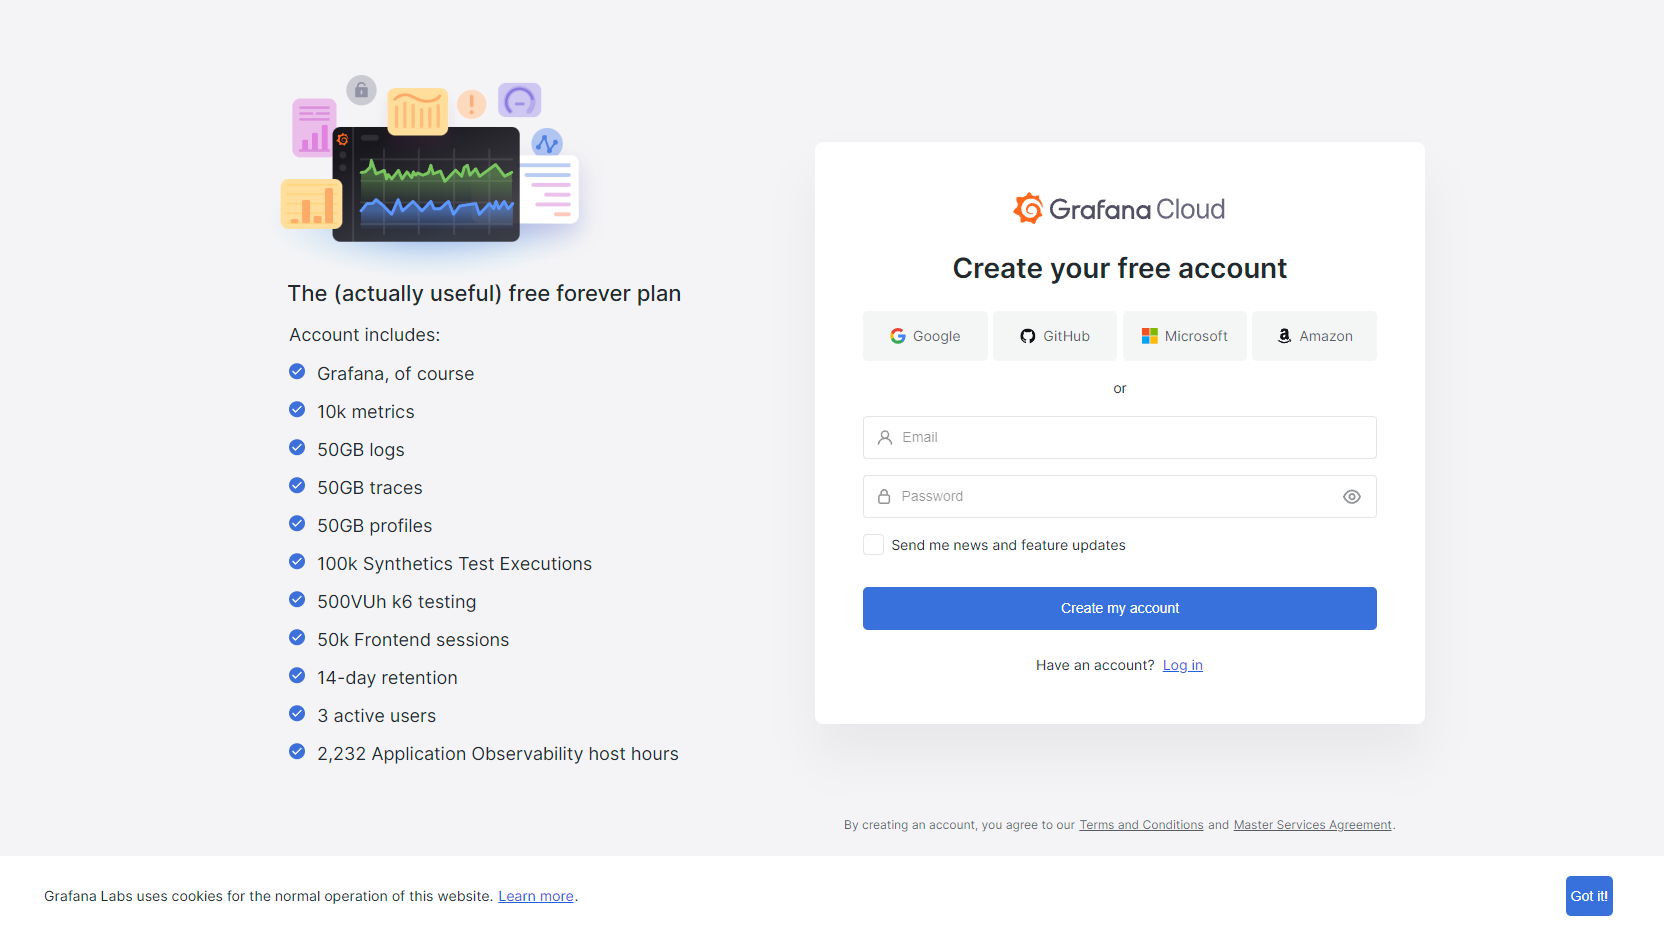
Sign in using one of the available options.
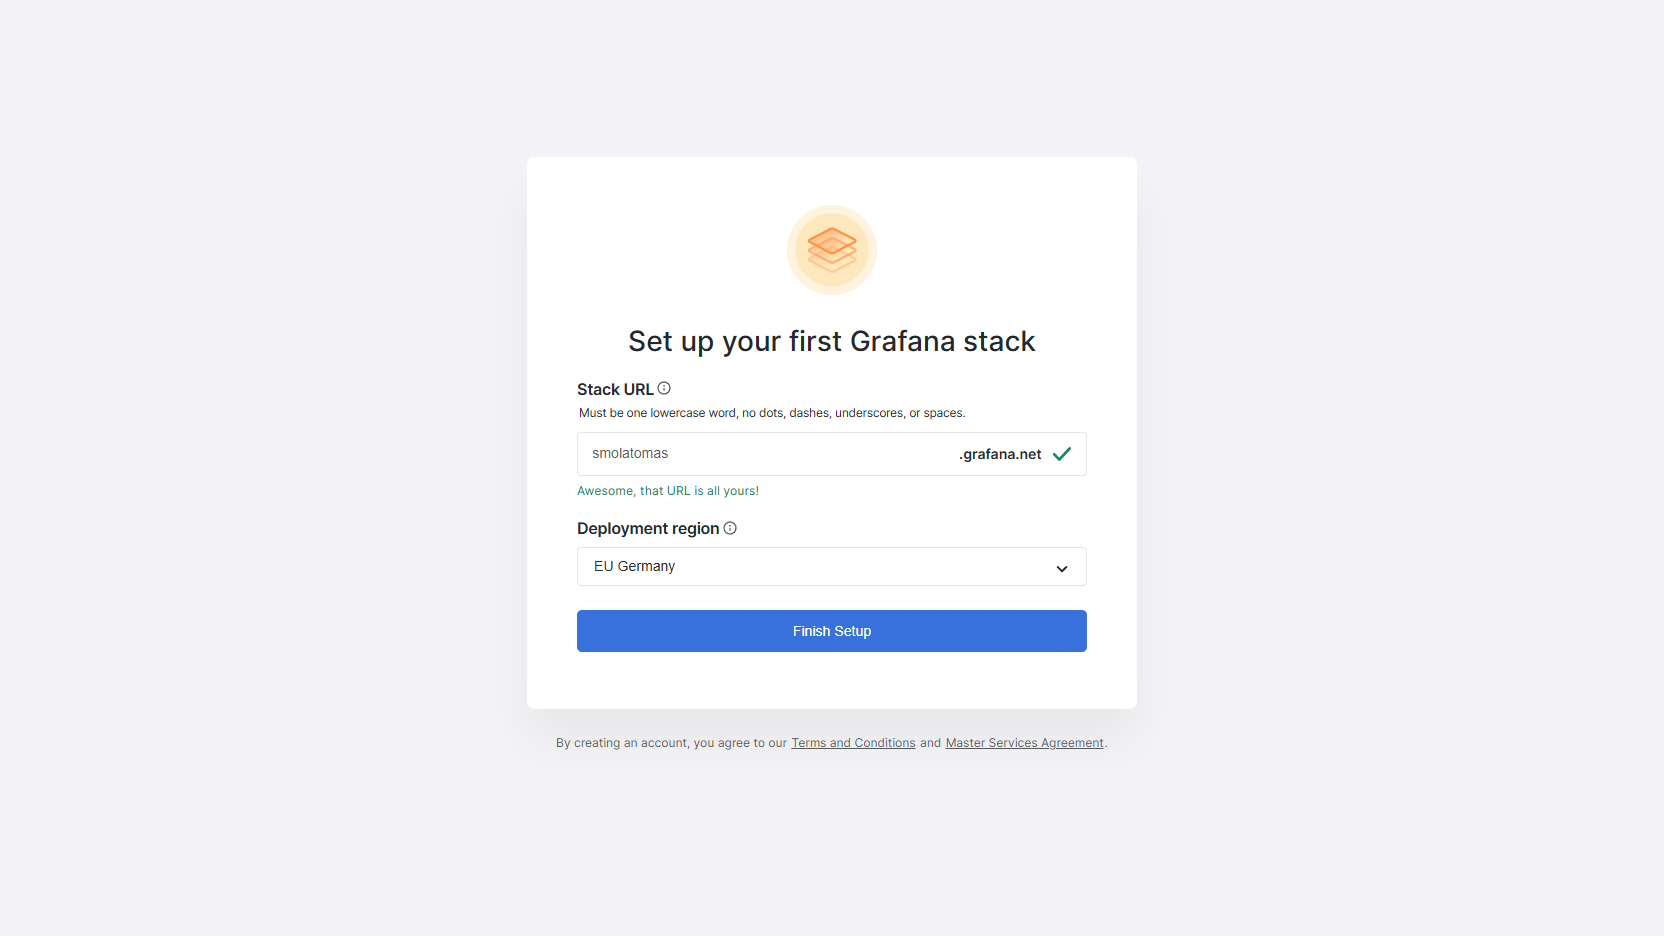
Fill in the details about your newly created Grafana stack and click Finish Setup. You will be redirected to Grafana UI, but go to Grafana Cloud Portal.
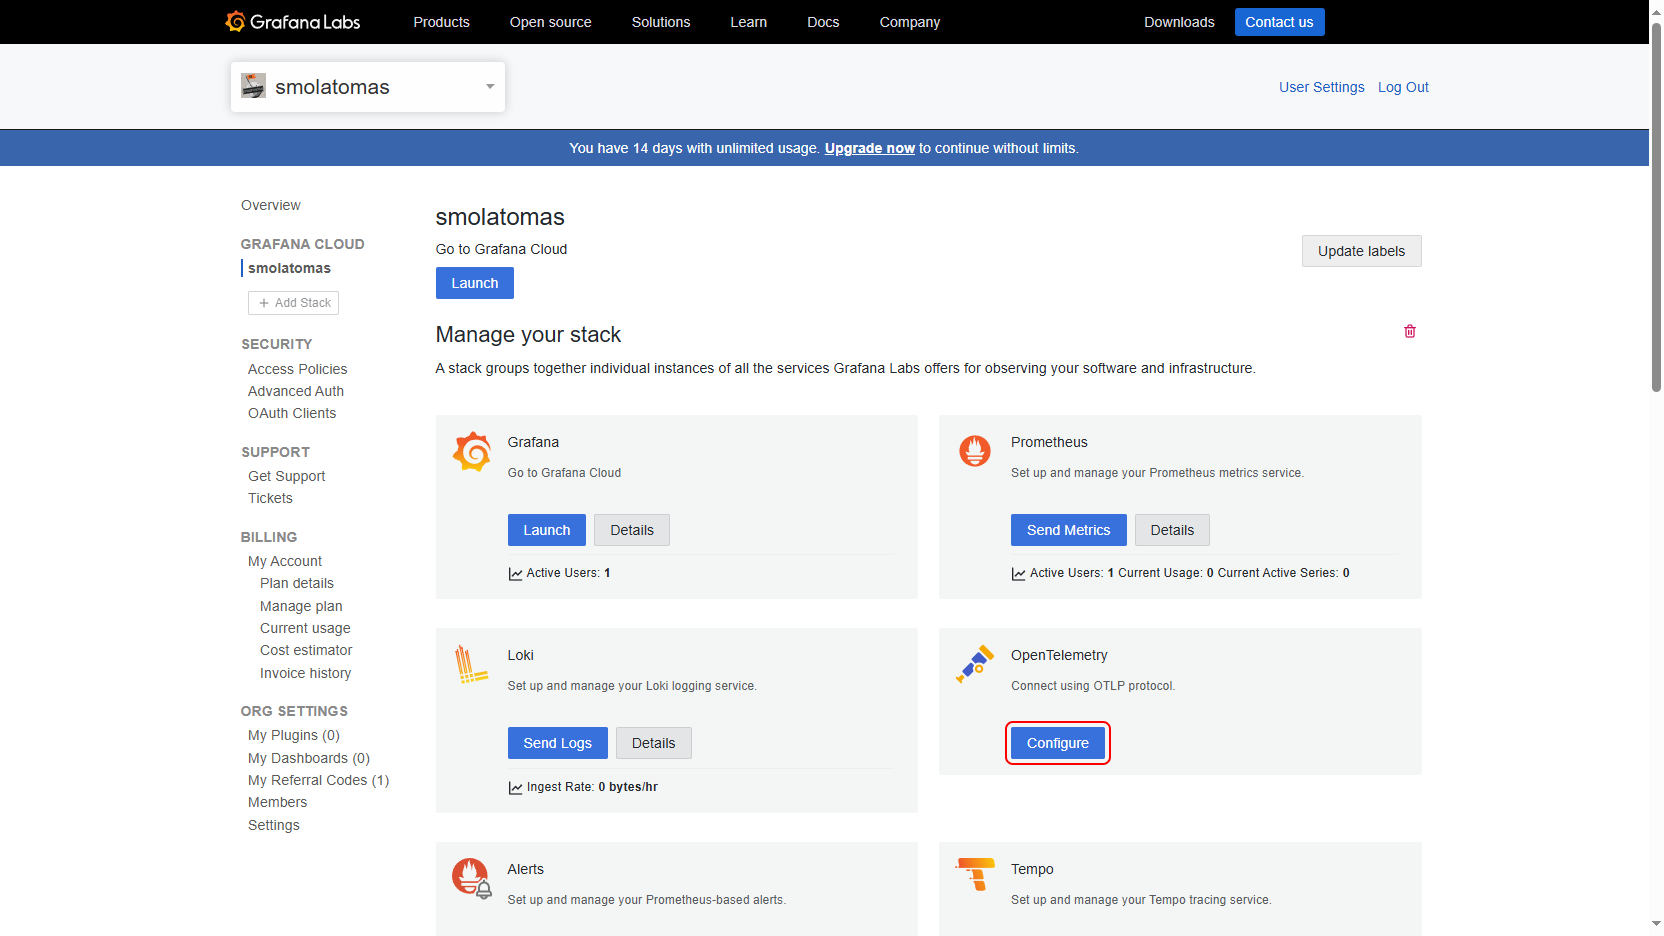
In the Grafana Cloud Portal, navigate to your stack by clicking on its name.
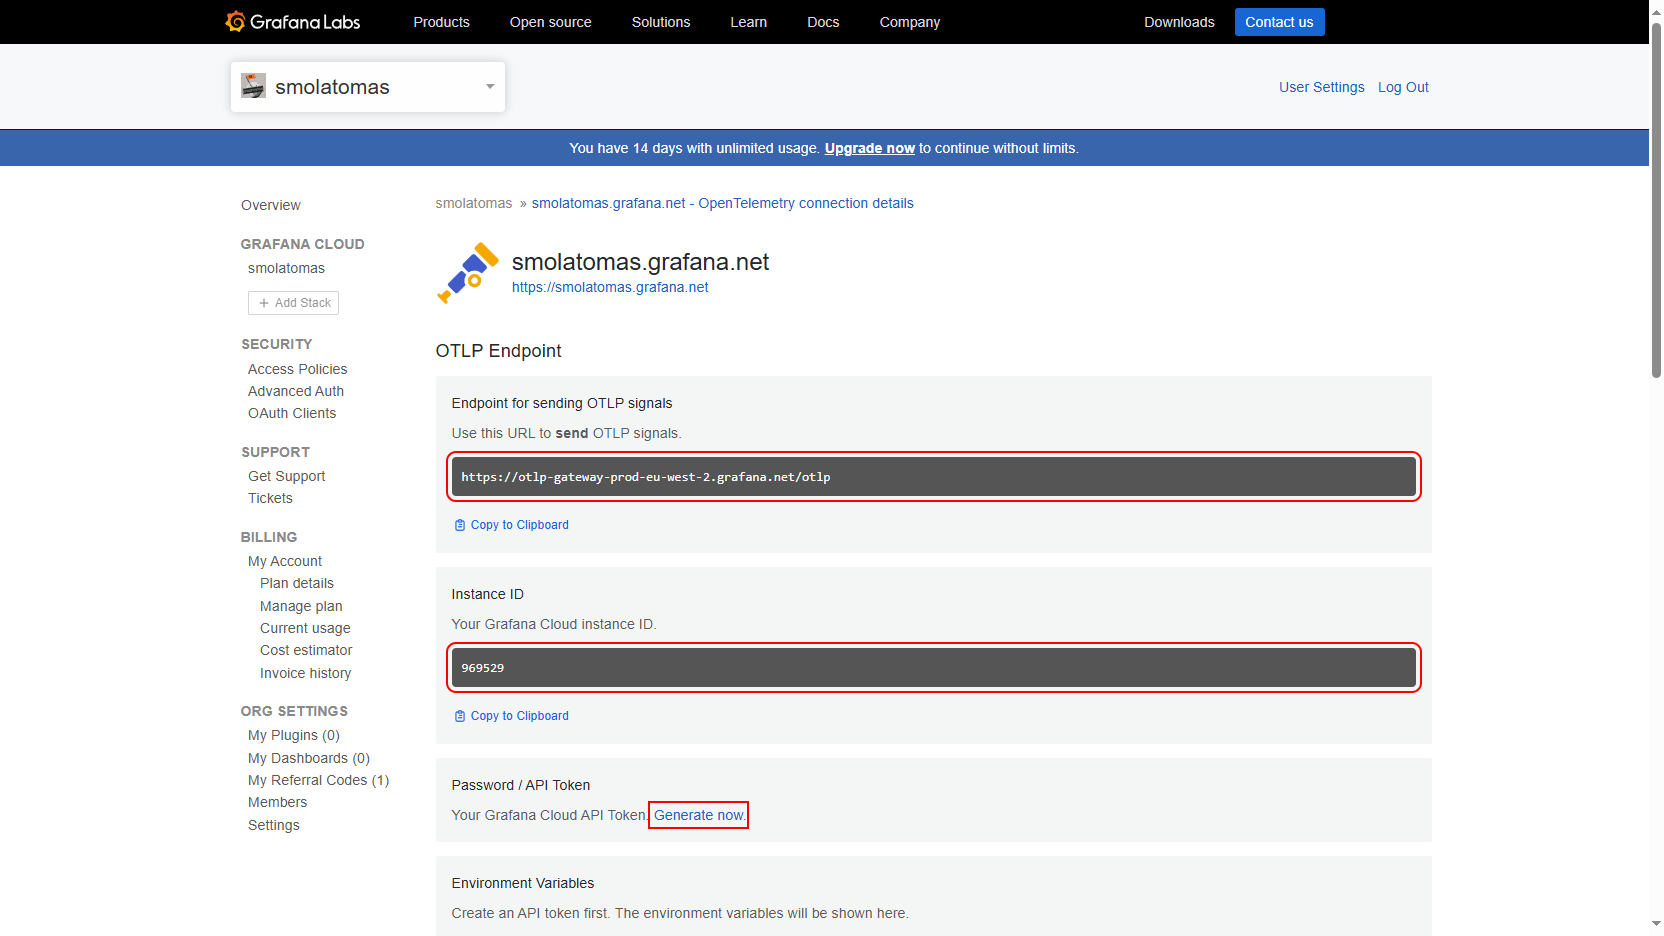
Click the Configure button in OpenTelemetry section.
Here you can find the details of your Grafana OTLP endpoint. You don't need to copy it now, but remember where to find it, you will need it later to configure Spotflow IoT Platform. Click Generate now.
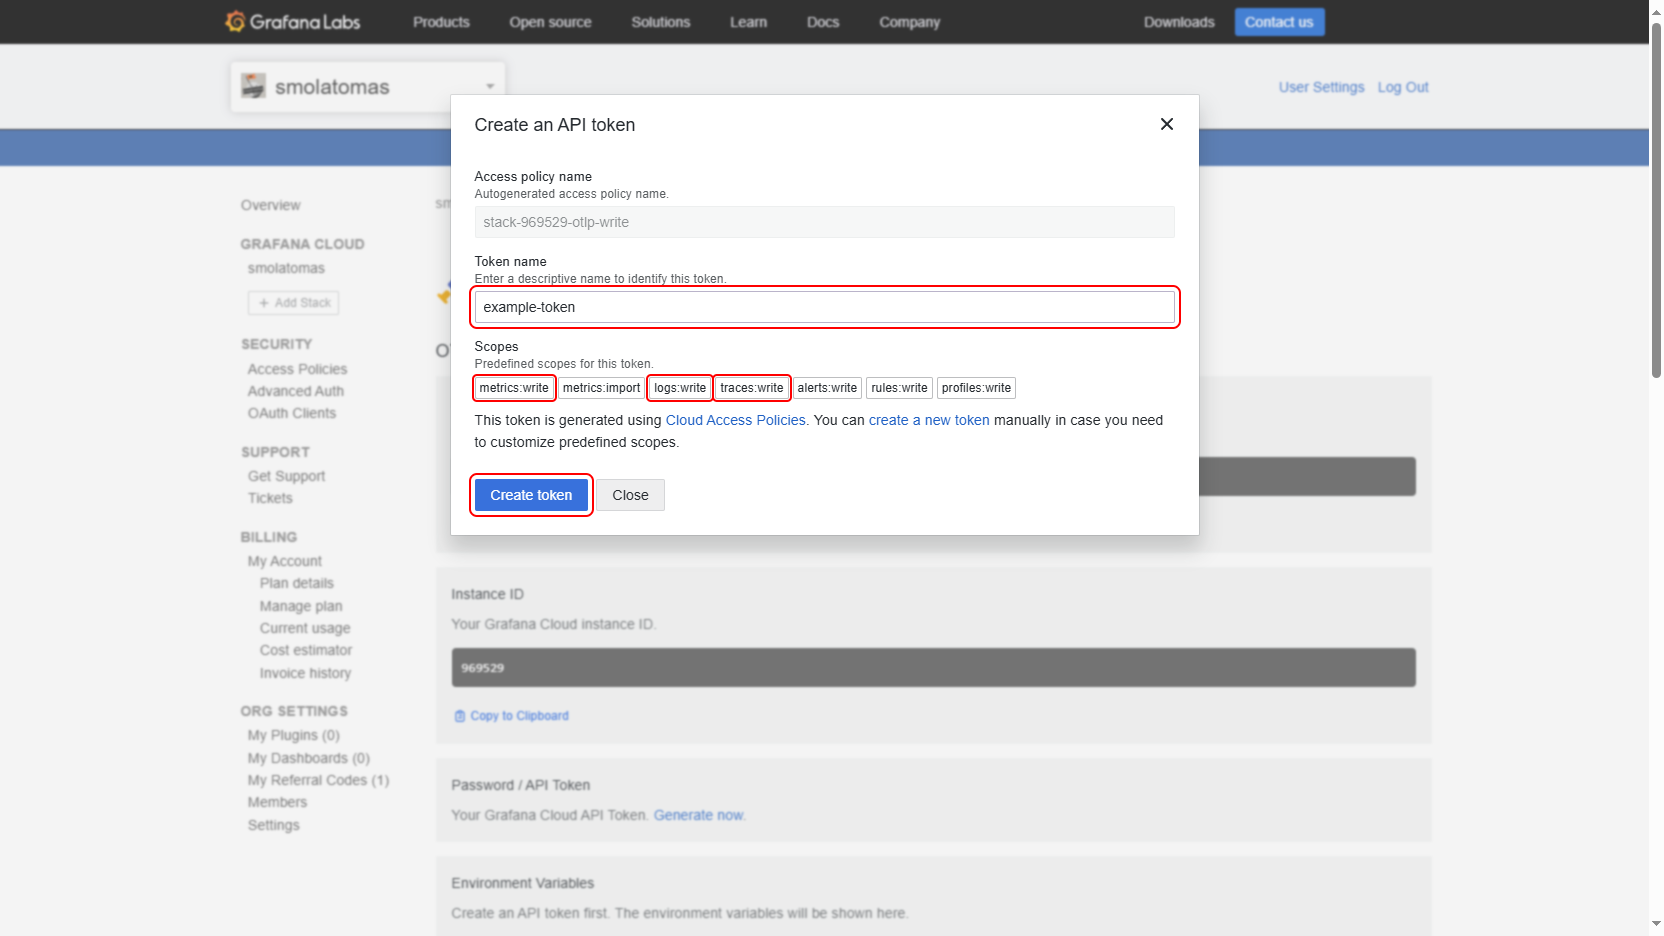
Name the token. The predefined scopes are sufficient, Spotflow IoT Platform requires
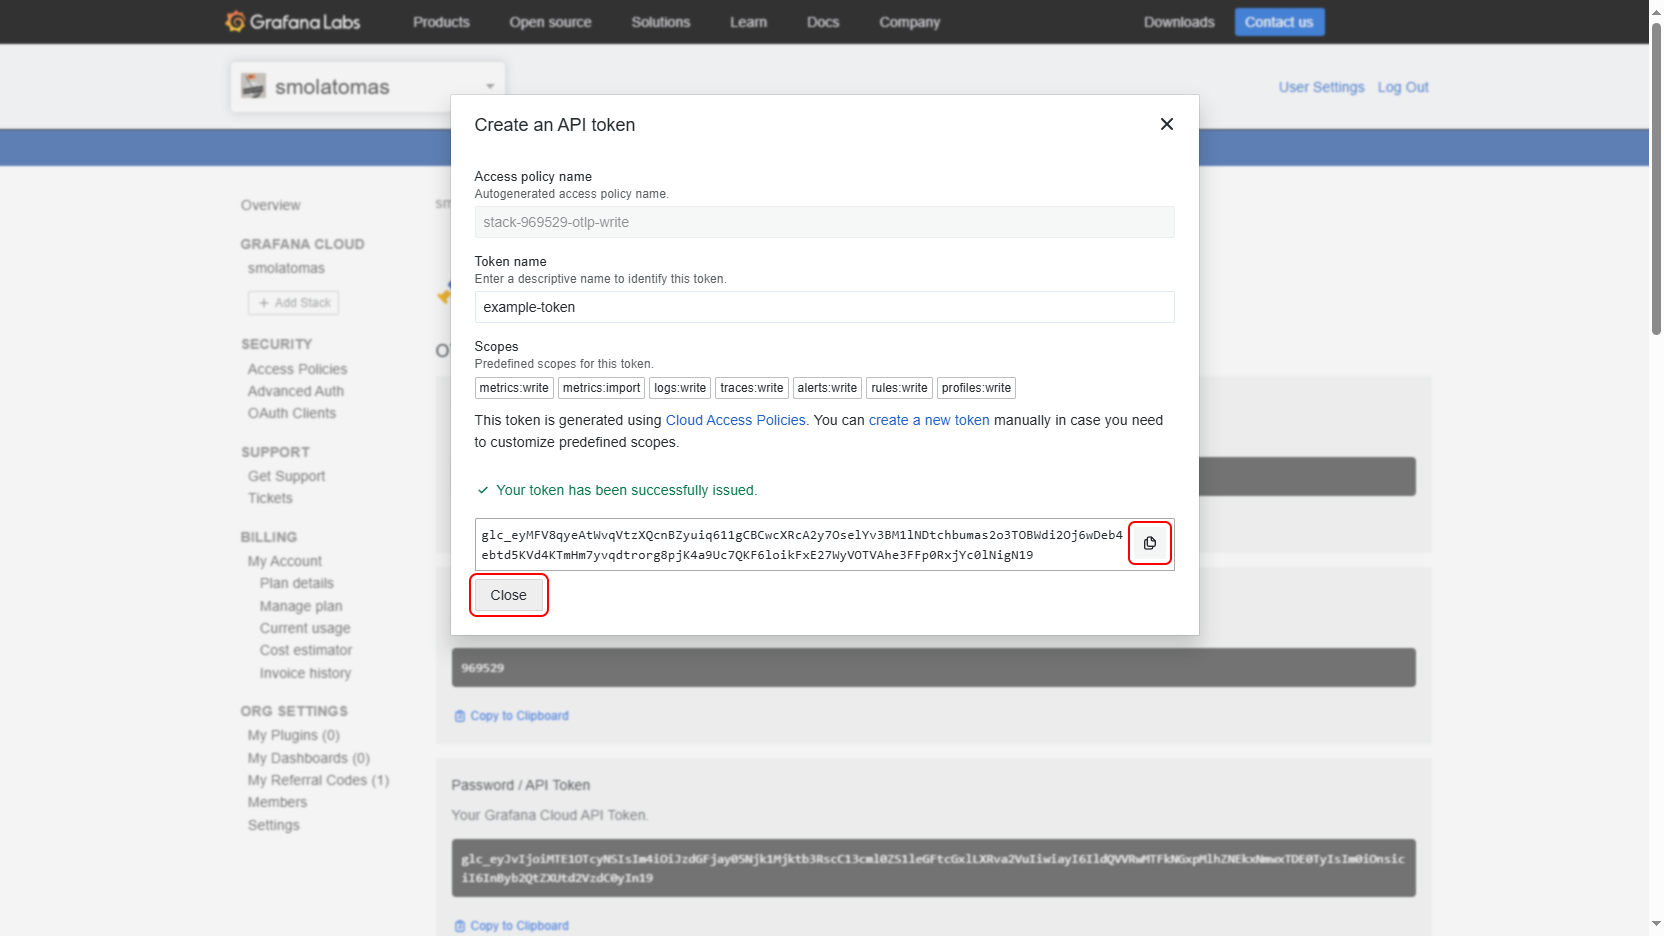
metrics:write,logs:writeandtraces:write. Click Create token.Copy and securely store the token, you won't be able to reveal it later. This is the credential token allowing Spotflow IoT Platform to write metrics, logs and traces to your Grafana. You can close the window now.
2. Route Data to a new OpenTelemetry Egress Sink
An OpenTelemetry Egress Sink represents an existing observability backend to which the Platform can forward data. Let's create a new one and configure a stream to forward data to it.
- Portal
- CLI
- API
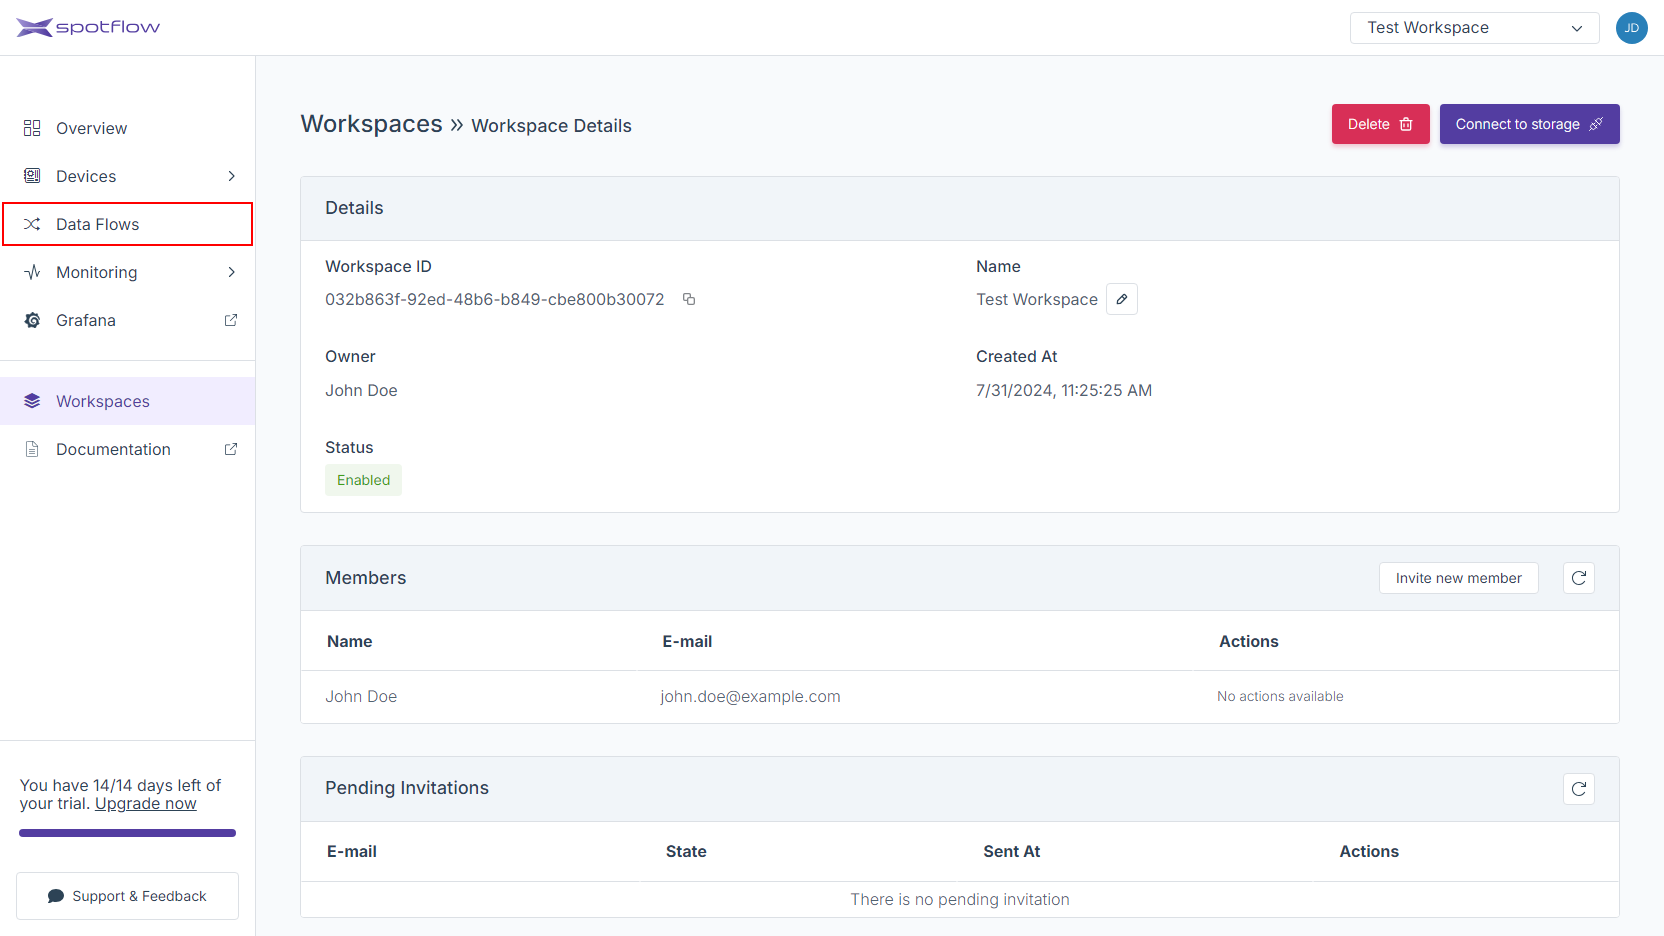
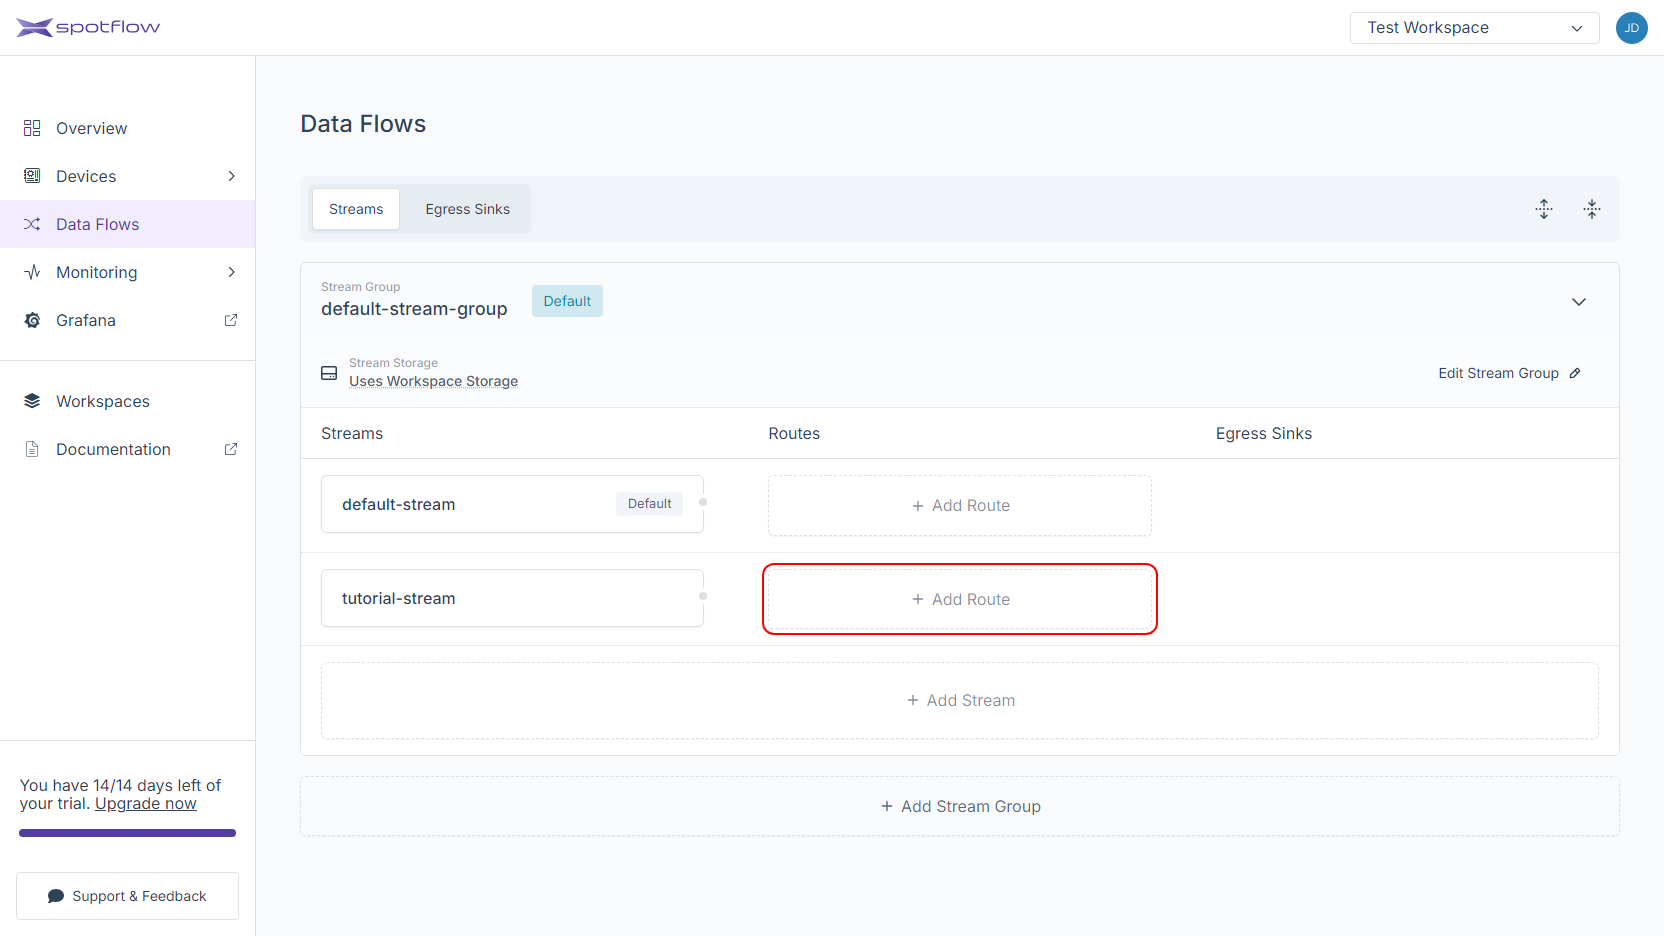
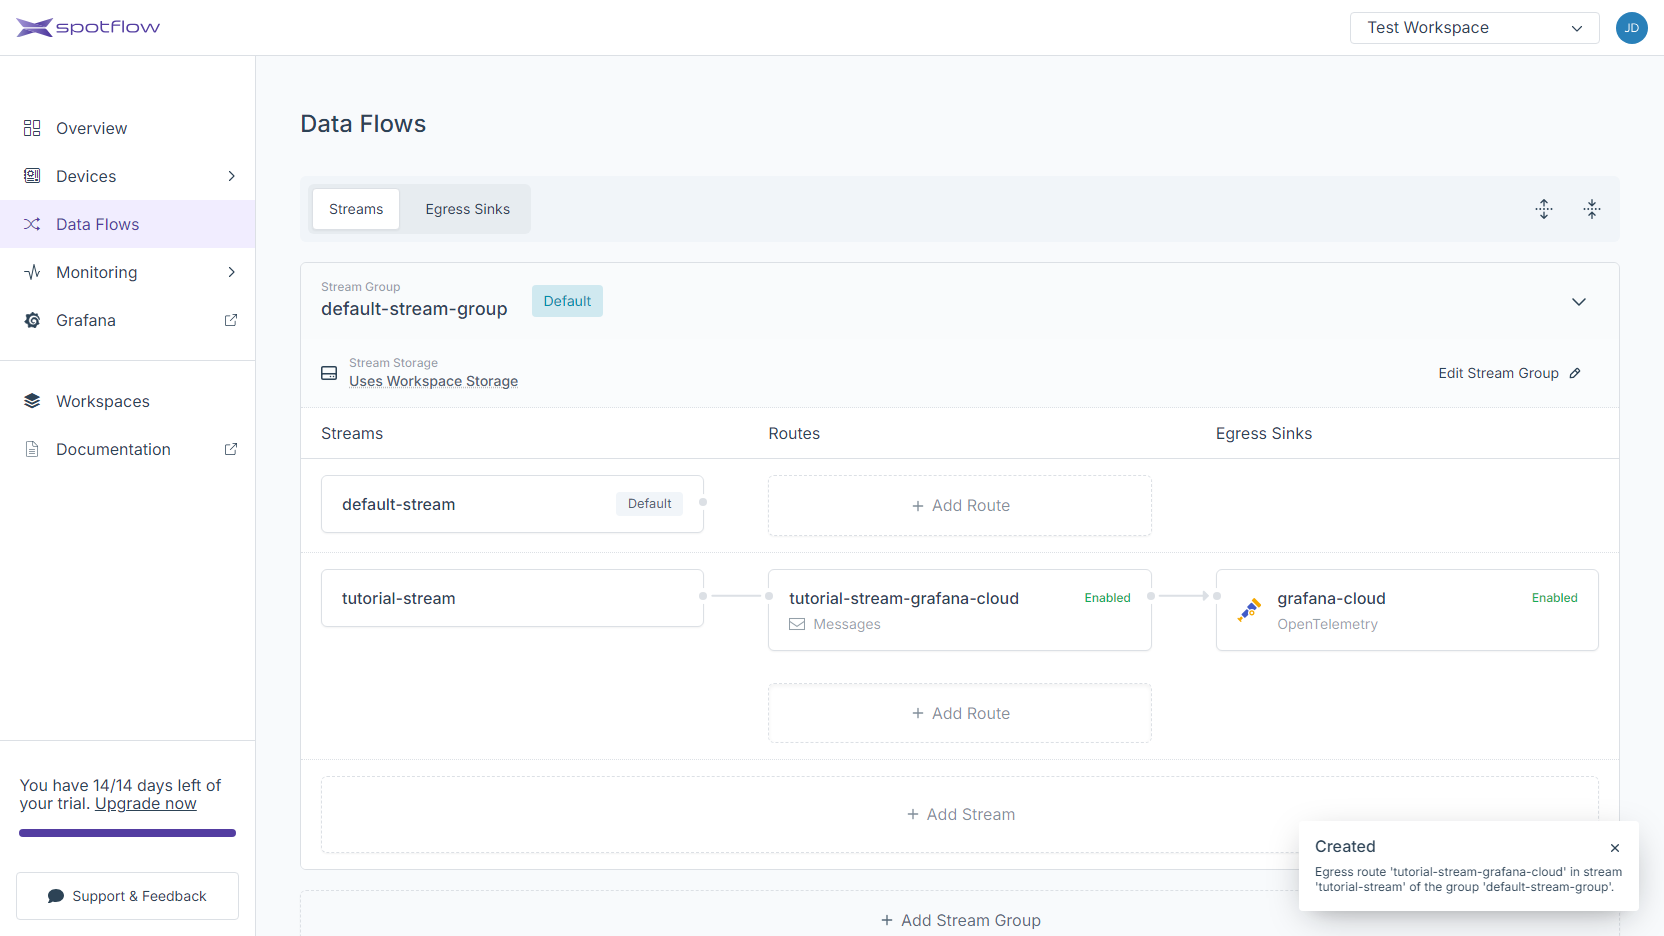
Click on Data Flows in the left sidebar.
Click on the Add Route button next to the stream that should be routed to the OTEL Egress Sink.
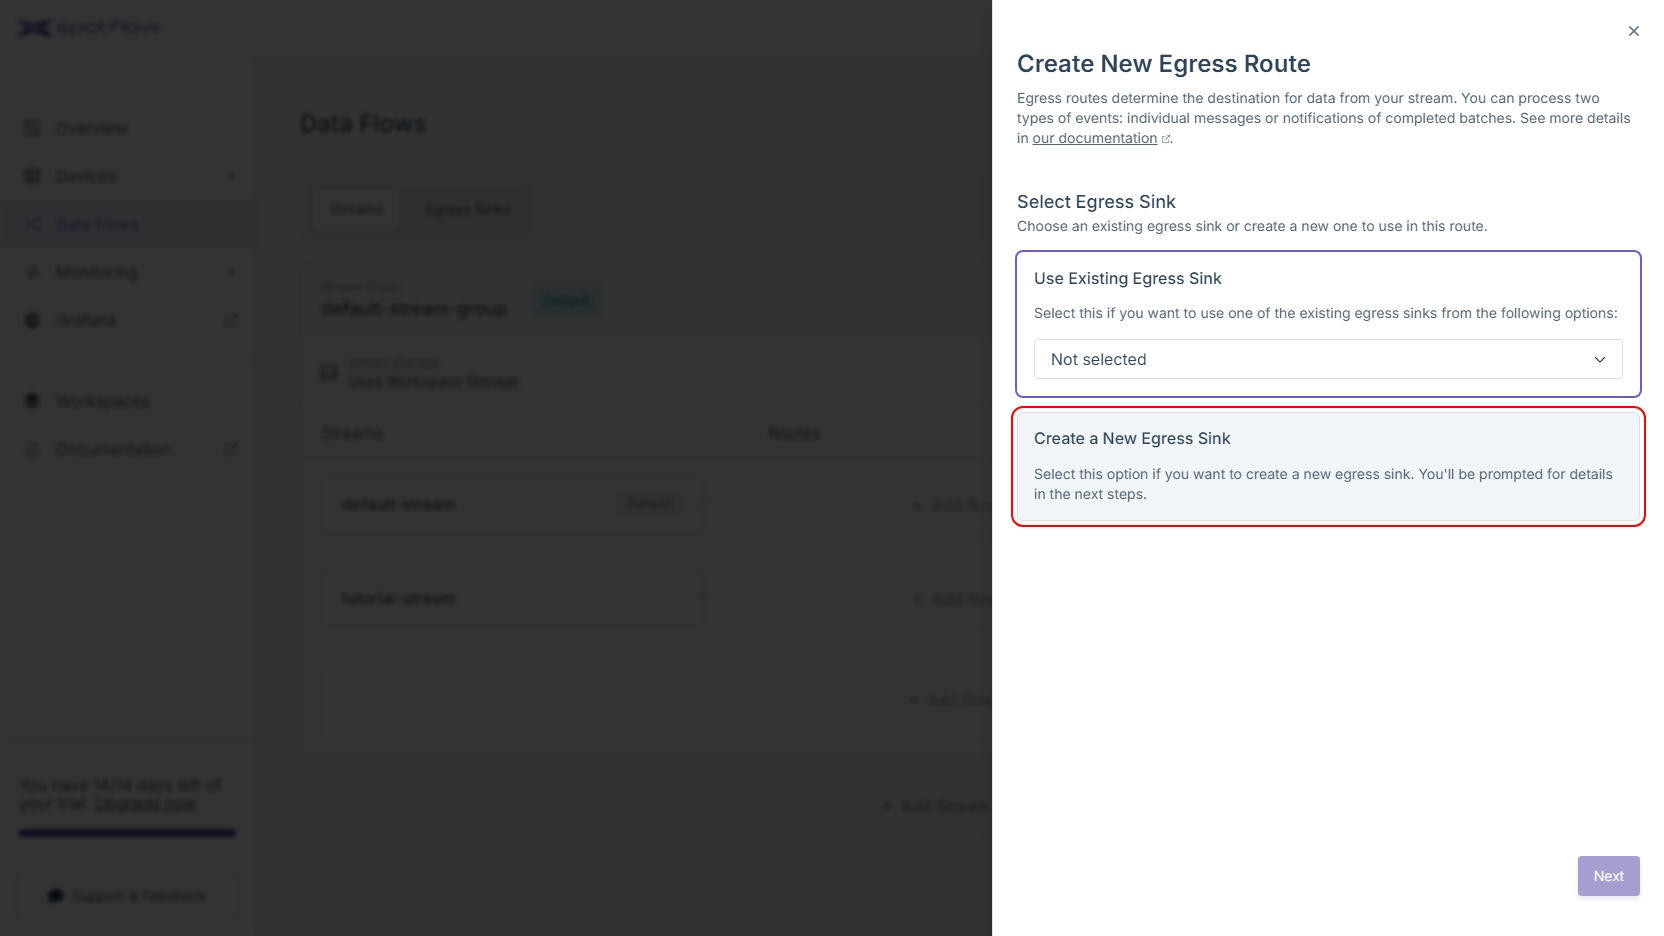
Choose the Create a New Egress Sink option and click on the Next button.
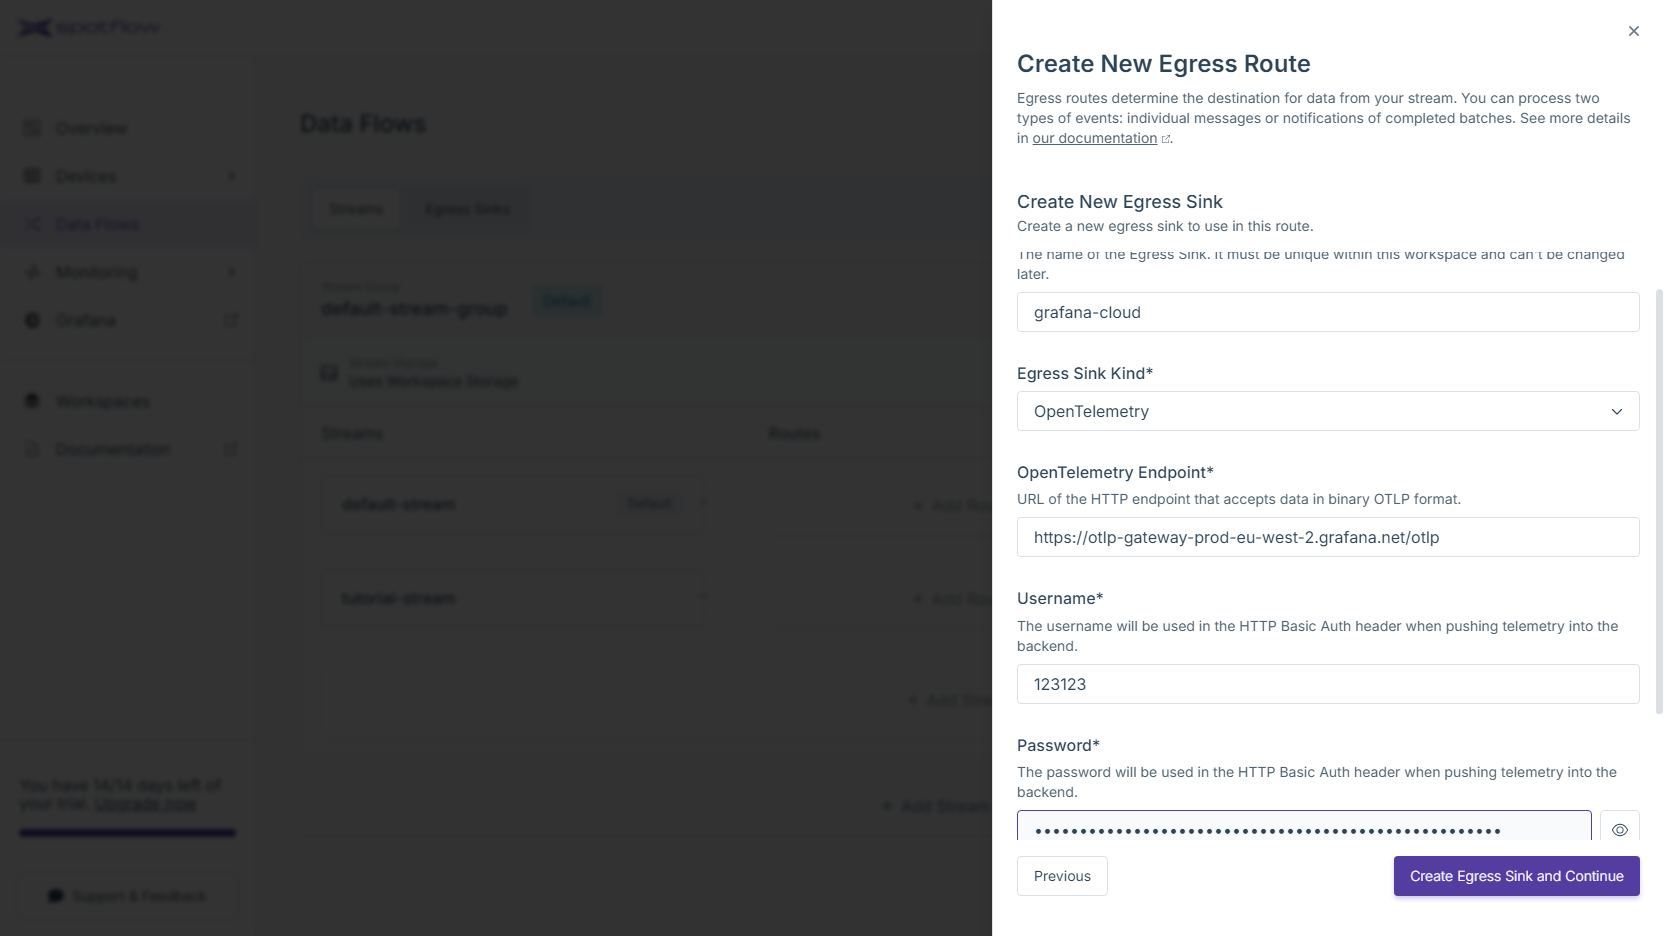
Fill the name of the Egress Sink, e.g.
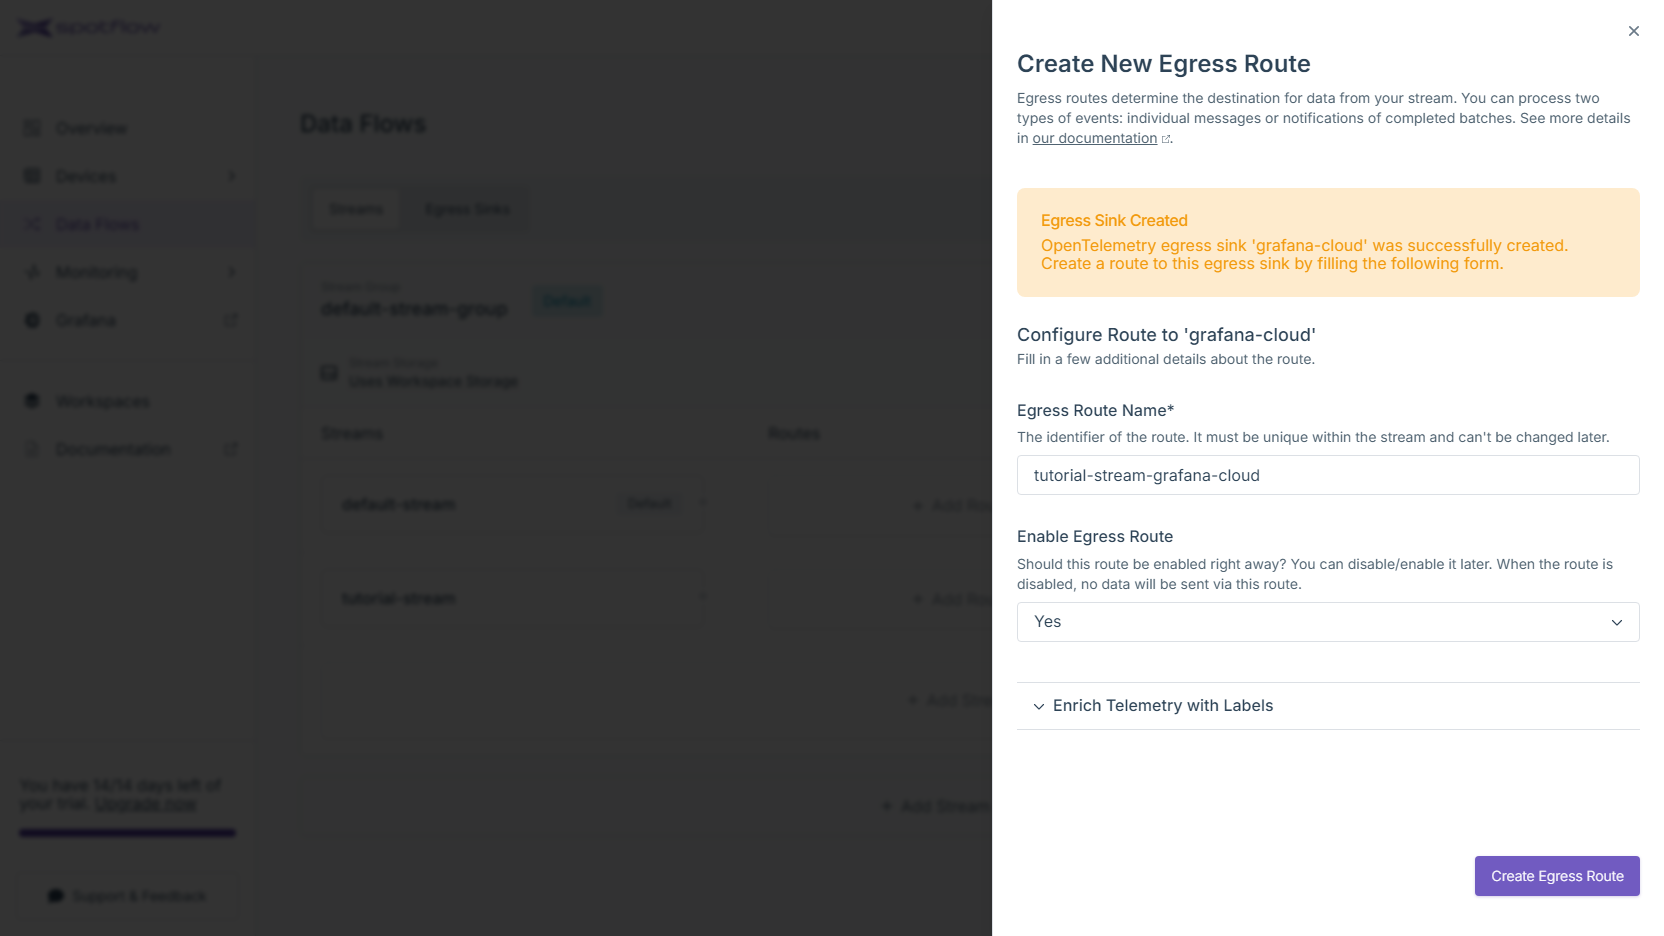
grafana-cloud. SelectOpenTelemetryas the egress sink kind. To configure the connection, you need to provide the URL of the OTLP endpoint, username and password. Click Create Egress Sink and Continue.The new OpenTelemetry Egress Sink is now created! At this point, it is only needed to create an egress route so the data from your stream are forwarded to this sink. Review the default configuration and optionally customize it. If you want to enrich the telemetry with labels such as
deviceId, expand the section Enrich Telemetry with Labels and select the appropriate labels. Click Create Egress Route to finish.The route to the new OpenTelemetry Egress Sink has been created! You should see an arrow going from your stream to the Egress Sink.
Spotflow CLI will support OpenTelemetry Egress Sink soon.
The following instructions expect that you have already obtained the API access token from the Portal and that you know the Workspace ID.
Create OpenTelemetry Egress Sink
Replace the placeholders <Your Workspace ID>, <Your Egress Sink Name>, <Your API Access Token>, <Your OTLP Backend Endpoint URL>, <Your OTLP Backend Endpoint Username> and <Your OTLP Backend Endpoint Password> with your Workspace ID, your OpenTelemetry Egress Sink name, your API access token, your OTLP backend endpoint URL and the credentials for basic authentication and run the following command to create a new OpenTelemetry Egress Sink:
- cURL
- PowerShell
curl -L -X PATCH 'https://api.eu1.spotflow.io/workspaces/<Your Workspace ID>/egress-sinks/<Your Egress Sink Name>' \
-H 'Content-Type: application/json' \
-H 'Accept: application/json' \
-H 'Authorization: Bearer <Your API Access Token>' \
--data-raw '{
  "properties": {
    "isEnabled": true,
    "config": {
      "otel": {
        "endpoint": "<Your OTLP Backend Endpoint URL>",
        "basicAuth": {
            "username": "<Your OTLP Backend Endpoint Username>",
            "password": "<Your OTLP Backend Endpoint Password>"
        }
      }
    }
  }
}'
(Invoke-WebRequest -Method Patch -Uri 'https://api.eu1.spotflow.io/workspaces/<Your Workspace ID>/egress-sinks/<Your Egress Sink Name>' `
 -Headers @{
   'Content-Type' = 'application/json'
   'Accept' = 'application/json'
   'Authorization' = 'Bearer <Your API Access Token>'
 } `
 -Body '{ "properties": { "isEnabled": true, "config": { "otel": { "endpoint": "<Your OTLP Backend Endpoint URL>", "basicAuth": { "username": "<Your OTLP Backend Endpoint Username>", "password": "<Your OTLP Backend Endpoint Password>" }}}}}').Content
The API will confirm the creation and display the OpenTelemetry Egress Sink details:
{
    "name": "my-otel-egress-sink",
    "workspaceId": "e618a6ff-5ee3-41c7-b2a2-ceae374afb2d",
    "ingressVersion": "V2",
    "version": 0,
    "properties": {
        "isEnabled": true,
        "config": {
            "otel": {
                "host": "https://otlp-gateway-prod-eu-west-3.grafana.net/otlp",
                "port": "443",
                "endpoint": "https://otlp-gateway-prod-eu-west-3.grafana.net/otlp",
                "basicAuth": {
                    "username": "836521"
                }
            }
        },
        "protocolVersion": "V2"
    }
}
Create Route to the Egress Sink
Replace the placeholders <Your Workspace ID>, <Your Stream Group Name>, <Your Stream Name>, <Your Egress Route Name>, <Your API Access Token> and <Your OpenTelemetry Egress Sink Name> with your Workspace ID, your Stream Group name, your Stream name, API access token and your OpenTelemetry Egress Sink name and run the following command to create a new Egress Route for Stream:
- cURL
- PowerShell
curl -L -X PATCH 'https://api.eu1.spotflow.io/workspaces/<Your Workspace ID>/stream-groups/<Your Stream Group Name>/streams/<Your Stream Name>/egress-routes/<Your Egress Route Name>' \
-H 'Content-Type: application/json' \
-H 'Accept: application/json' \
-H 'Authorization: Bearer <Your API Access Token>' \
  --data-raw '{
    "properties": {
      "isEnabled": true,
      "egressSinkName": "<Your OpenTelemetry Egress Sink Name>",
      "config": {
        "otel": {
          "applyResourceLabels": {
            "logs": {
            "deviceId": true,
            "streamGroupName": true,
            "streamName": true
          },
            "metrics": {
            "deviceId": true,
            "streamGroupName": true,
            "streamName": true
          },
            "traces": {
            "deviceId": true,
            "streamGroupName": true,
            "streamName": true
          }
        }
      }
    },
      "input": "Messages"
    }
  }'
(Invoke-WebRequest -Method Patch -Uri 'https://api.eu1.spotflow.io/workspaces/<Your Workspace ID>/stream-groups/<Your Stream Group Name>/streams/<Your Stream Name>/egress-routes/<Your Egress Route Name>' `
-Headers @{
  'Content-Type' = 'application/json'
  'Accept' = 'application/json'
  'Authorization' = 'Bearer <Your API Access Token>'
} `
-Body '{ "properties": { "isEnabled": true, "egressSinkName": "<Your OpenTelemetry Egress Sink Name>", "config": { "otel": { "applyResourceLabels": { "logs": { "deviceId": true, "streamGroupName": true, "streamName": true }, "metrics": { "deviceId": true, "streamGroupName": true, "streamName": true }, "traces": { "deviceId": true, "streamGroupName": true, "streamName": true }}}}, "input": "Messages" }}').Content
The API will confirm the creation and display the Egress Route details:
{
  "name": "route-to-otel1",
  "workspaceId": "e618a6ff-5ee3-41c7-b2a2-ceae374afb2d",
  "streamGroupName": "my-new-stream-group",
  "streamName": "my-new-stream",
  "version": 0,
  "properties": {
    "isEnabled": true,
    "egressSinkName": "my-otel-egress-sink",
    "config": {
      "otel": {
        "applyResourceLabels": {
          "logs": {
            "deviceId": true,
            "siteId": false,
            "streamGroupName": true,
            "streamName": true
          },
          "metrics": {
            "deviceId": true,
            "siteId": false,
            "streamGroupName": true,
            "streamName": true
          },
          "traces": {
            "deviceId": true,
            "siteId": false,
            "streamGroupName": true,
            "streamName": true
          }
        }
      }
    },
    "input": "Messages"
  }
}
3. Send Data to Platform
Once the Spotflow IoT Platform is configured as described above, you can start exporting telemetry signals from your Device's program using the Device SDK. There are only two requirements when sending data to an OpenTelemetry Egress Sink:
- You must send the signals in the binary Protobuf encoding.
- You must set the Batch Slice ID of each message depending on which signal are you exporting.
The following values are allowed:
logs,metrics, andtraces.
Example Using Device SDK to Export Metrics
- Python
- C++
- Rust
Your telemetry data can be exported from your Device's program with the help of the standard OpenTelemetry SDK. Specifically, we recommend creating a custom metric exporter. This allows you to instrument your Device's program in the standard way, and the telemetry signals will be automatically routed to your observability backend.
Obtain Dependencies
Install the recent Device SDK and OpenTelemetry SDK for Python using the following command:
pip install --upgrade spotflow-device opentelemetry-sdk opentelemetry-exporter-otlp-proto-common
Create Custom OTEL Exporter
You can create a custom OTEL exporter by implementing the opentelemetry.sdk.metrics.export.MetricExporter abstract class.
To start collecting metrics using the custom exporter, you need to create a metric reader and pass it to your MeterProvider.
Take a look at the following simple implementation:
import time
from typing import Dict

from opentelemetry import metrics
from opentelemetry.exporter.otlp.proto.common.metrics_encoder import encode_metrics
from opentelemetry.proto.metrics.v1.metrics_pb2 import AggregationTemporality
from opentelemetry.sdk.metrics.export import MetricExporter, MetricExportResult, MetricsData, PeriodicExportingMetricReader
from opentelemetry.sdk.metrics.view import Aggregation
from opentelemetry.sdk.metrics import MeterProvider

from spotflow_device import StreamSender, DeviceClient

class SpotflowMetricExporter(MetricExporter):
    def __init__(
        self,
        stream_sender: StreamSender,
        preferred_temporality: Dict[type, AggregationTemporality] = None,
        preferred_aggregation: Dict[type, Aggregation] = None,
    ):
        super().__init__(
            preferred_temporality=preferred_temporality,
            preferred_aggregation=preferred_aggregation,
        )
        self.__stream_sender = stream_sender

    def export(self, metrics_data: MetricsData, timeout_millis: float = 10_000, **kwargs) -> MetricExportResult:
        print("Sending metrics.")
        # Serialize metrics data and send it via StreamSender
        self.__stream_sender.send_message(encode_metrics(metrics_data).SerializeToString(), batch_slice_id="metrics")
        return MetricExportResult.SUCCESS

    def force_flush(self, timeout_millis: float = 10_000) -> bool:
        return True

    def shutdown(self, timeout_millis: float = 30_000, **kwargs) -> None:
        return None

# Connect to the Platform (starts Device Provisioning if the Device is not already registered)
client = DeviceClient.start(device_id="my-device", provisioning_token="<Your Provisioning Token>", db="spotflow.db")

# Create a sender to the stream of your choice
sender = client.create_stream_sender(stream_group = "my-new-stream-group", stream = "my-new-stream")

# Initialize the custom exporter
spotflow_exporter = SpotflowMetricExporter(sender)

# Set up the periodic exporting metric reader
metric_reader = PeriodicExportingMetricReader(spotflow_exporter, export_interval_millis=1000)

# Set up the meter provider with the metric reader
meter_provider = MeterProvider(metric_readers=[metric_reader], shutdown_on_exit=False)

# Register the meter provider globally
metrics.set_meter_provider(meter_provider)

# Get a meter from the provider
meter = meter_provider.get_meter("custom-meter")

# Create a counter instrument
counter = meter.create_counter("counter")

# Record metrics in a loop
for i in range(15):
    counter.add(1)
    time.sleep(1)
Note that there are only two concepts specific to the Spotflow IoT Platform in the code:
- The class requires an instance of
StreamSenderin its constructor. This stream sender must be configured to send messages into the stream that is routed to your OpenTelemetry egress sink. - The
exportmethod sends the data via the aforementionedStreamSenderinstance. Remember, that the telemetry data must be encoded in the binary Protobuf format. In the example this is achieved with the OpenTelemetry SDK. Lastly, it's important to note that thebatch_slice_idparameter needs to be set tometricsin this case.
Run Program
Paste the code above into a new file, or download it.
Replace the placeholder <Your Provisioning Token> with your Provisioning Token, enter your Stream Group and Stream, and run the program:
python send_otel_data.py
DeviceClient.start will display the Provisioning Operation ID and Verification Code:
Provisioning operation initialized, waiting for approval.
Operation ID: eb82df7f-63ab-429f-80df-f0ae05f57306
Verification Code: 3cwz1g1c
After you approve the operation in the next step, the Device will start sending metrics to the Platform.
Since the OpenTelemetry SDK for C doesn't exist, we'll show the example using the OpenTelemetry SDK for C++. If your remaining code is in C, you can create a C wrapper around the C++ code that uses the SDK.
We recommend creating a custom metric exporter using the SDK. This allows you to instrument your Device's program in the standard way, and the telemetry signals will be automatically routed to your observability backend.
Obtain Dependencies
The example requires the following libraries:
- Spotflow Device SDK
- OpenTelemetry SDK for C++ with OTLP HTTP exporter
- Protobuf library
First, create a folder that will hold all the sources and dependencies needed for the example:
mkdir send_otel_data
cd send_otel_data
Download the latest version of the Spotflow Device SDK library for your operating system and processor architecture:
Extract the contents of the archive to send_otel_data/spotflow_device.
Gather the remaining dependencies for your operating system:
- Windows
- Linux
Since the OpenTelemetry SDK documentation recommends cloning the repository and compiling it using CMake, we'll use this approach here as well. Therefore, you'll need the following tools installed locally:
- Git
- C++ compiler supporting C++17
- CMake of version ≥ 3.25
Then, download the current version of the OpenTelemetry SDK and compile it together with the OLTP HTTP exporter and Protobuf library:
git clone --recurse-submodules https://github.com/open-telemetry/opentelemetry-cpp
cd opentelemetry-cpp
mkdir build
cd build
cmake -DBUILD_TESTING=OFF -DWITH_DEPRECATED_SDK_FACTORY=OFF -DWITH_OTLP_HTTP=ON ..
cmake --build . --config Debug
cmake --install . --prefix ../../otel-cpp --config Debug
cd ../..
The compilation will most likely take a long time because there are many different transitive dependencies.
After you run all the commands, the folder send_otel_data should contain two folders: opentelemetry-cpp with the sources and otel-cpp with the headers and compiled libraries.
Add the following CMakeLists.txt file to the send_otel_data folder:
cmake_minimum_required(VERSION 3.25)
project(SendOtelData)
set(CMAKE_CXX_STANDARD 17)

# Add reference to OpenTelemetry C++ SDK
include_directories(${CMAKE_SOURCE_DIR}/otel-cpp/include)
link_libraries(${CMAKE_SOURCE_DIR}/otel-cpp/lib/*.lib)

# Add headers for Protocol Buffers
include_directories(${CMAKE_SOURCE_DIR}/opentelemetry-cpp/tools/vcpkg/packages/protobuf_x64-windows/include)
link_libraries(${CMAKE_SOURCE_DIR}/opentelemetry-cpp/tools/vcpkg/packages/protobuf_x64-windows/debug/lib/libprotobufd.lib)

# Include the dynamic library for Protocol Buffers in the output directory in a post build step
file(COPY ${CMAKE_SOURCE_DIR}/opentelemetry-cpp/tools/vcpkg/packages/protobuf_x64-windows/debug/bin/libprotobufd.dll
     DESTINATION ${CMAKE_BINARY_DIR}/Debug)

# Add reference to Spotflow Device SDK
include_directories(${CMAKE_SOURCE_DIR}/spotflow_device/include)
link_libraries(${CMAKE_SOURCE_DIR}/spotflow_device/lib/spotflow.lib
               ws2_32.lib
               bcrypt.lib
               userenv.lib
               ntdll.lib
               crypt32.lib
               secur32.lib
               ncrypt.lib)

add_executable(send_otel_data send_otel_data.cpp)
The folder should now contain the following folders and files:
opentelemetry-cpp/
otel-cpp/
spotflow_device/
CMakeLists.txt
Because the way to acquire individual dependencies may vary depending on the Linux distribution, we recommend following the official instructions to build the OpenTelemetry SDK. These CMake build variables make sure that the OpenTelemetry SDK build contains the necessary components:
-DBUILD_TESTING=OFF- Disables building tests.-DWITH_DEPRECATED_SDK_FACTORY=OFF- Ensures that the latest interface for SDK factories is compiled. We use it in the code example.-DWITH_OTLP_HTTP=ON- Enables the OTLP HTTP exporter. A part of it is the interface for transforming telemetry data into the binary Protobuf format.
Unless your package manager provides a recent version of Protocol Buffers, you may need to build it from source as well.
Eventually, we recommend creating a CMakeLists.txt file to the send_otel_data folder.
Refer to the same file for Windows, but adjust the paths to the libraries and headers accordingly.
Create Custom OTEL Exporter
You can create a custom OTEL exporter by implementing the opentelemetry::sdk::metrics::PushMetricExporter abstract class.
To start collecting metrics using the custom exporter, you need to create a metric reader and pass it to your MeterProvider.
Take a look at the following implementation:
#include <iostream>
#include <memory>

#include "google/protobuf/arena.h"
#include "opentelemetry/exporters/ostream/metric_exporter_factory.h"
#include "opentelemetry/exporters/otlp/otlp_metric_utils.h"
#include "opentelemetry/metrics/provider.h"
#include "opentelemetry/proto/collector/metrics/v1/metrics_service.pb.h"
#include "opentelemetry/sdk/metrics/export/periodic_exporting_metric_reader_factory.h"
#include "opentelemetry/sdk/metrics/export/periodic_exporting_metric_reader_options.h"
#include "opentelemetry/sdk/metrics/export/metric_producer.h"
#include "opentelemetry/sdk/metrics/instruments.h"
#include "opentelemetry/sdk/metrics/meter_provider_factory.h"
#include "opentelemetry/sdk/trace/exporter.h"

extern "C" {
    #include "spotflow.h"
}

#ifndef _WIN32
#include <unistd.h>
#define Sleep(x) usleep((x)*1000)
#endif

void show_last_spotflow_error()
{
    auto buffer = std::make_unique<char[]>(SPOTFLOW_ERROR_MAX_LENGTH);
    spotflow_read_last_error_message(buffer.get(), SPOTFLOW_ERROR_MAX_LENGTH);
    std::cout << "Error: " << buffer.get() << std::endl;
}

class SpotflowClientHolder
{
public:
    SpotflowClientHolder(const char* device_id, const char* provisioning_token, const char* database_file)
    {
        spotflow_client_options_t* options;
        spotflow_client_options_create(&options, device_id, provisioning_token, database_file);

        if (spotflow_client_start(&_client, options) != SPOTFLOW_OK)
        {
            show_last_spotflow_error();
            throw std::runtime_error("Failed to start the Spotflow client.");
        }

        spotflow_client_options_destroy(options);
    }

    ~SpotflowClientHolder()
    {
        spotflow_client_destroy(_client);
    }

    spotflow_client_t* get() const
    {
        return _client;
    }

private:
    spotflow_client_t* _client;
};

class SpotflowMetricExporter : public opentelemetry::sdk::metrics::PushMetricExporter
{
public:
    SpotflowMetricExporter(
        std::shared_ptr<SpotflowClientHolder> client_holder,
        const char* stream_group,
        const char* stream,
        opentelemetry::sdk::metrics::AggregationTemporality aggregation_temporality)
        : _client_holder(client_holder),
          _aggregation_temporality(aggregation_temporality),
          opentelemetry::sdk::metrics::PushMetricExporter()
    {
        spotflow_message_context_create(&_message_context, stream_group, stream);
    }

    ~SpotflowMetricExporter()
    {
        spotflow_message_context_destroy(_message_context);
    }

    opentelemetry::sdk::common::ExportResult
    Export(const opentelemetry::sdk::metrics::ResourceMetrics& data) noexcept override
    {
        printf("Sending metrics.\n");

        google::protobuf::Arena arena;
        auto *service_request =
            google::protobuf::Arena::CreateMessage<opentelemetry::proto::collector::metrics::v1::ExportMetricsServiceRequest>(&arena);

        // Serialize the metrics to a Protobuf message
        opentelemetry::exporter::otlp::OtlpMetricUtils::PopulateRequest(data, service_request);
        auto message = service_request->SerializeAsString();

        // Send the serialized message to the Platform
        auto result = spotflow_client_send_message_advanced(
            _client_holder->get(),
            _message_context,
            NULL,                       // batch_id
            "metrics",                  // batch_slice_id
            NULL,                       // message_id
            NULL,                       // chunk_id
            (uint8_t*)message.c_str(),
            message.size());

        if (result != SPOTFLOW_OK)
        {
            show_last_spotflow_error();
            return opentelemetry::sdk::common::ExportResult::kFailure;
        }

        return opentelemetry::sdk::common::ExportResult::kSuccess;
    }

    opentelemetry::sdk::metrics::AggregationTemporality
    GetAggregationTemporality(opentelemetry::sdk::metrics::InstrumentType instrument_type) const noexcept override
    {
        return _aggregation_temporality;
    }

    bool ForceFlush(std::chrono::microseconds timeout) noexcept override
    {
        return true;
    }

    bool Shutdown(std::chrono::microseconds timeout) noexcept override
    {
        return true;
    }

private:
    std::shared_ptr<SpotflowClientHolder> _client_holder;
    spotflow_message_context_t* _message_context;
    opentelemetry::sdk::metrics::AggregationTemporality _aggregation_temporality;
};

int main(int argc, char* argv[]) {
    // Connect to the Platform (starts Device Provisioning if the Device is not already registered)
    auto client_holder = std::make_shared<SpotflowClientHolder>("my-device", "<Your Provisioning Token>", "spotflow.db");

    // Initialize the custom exporter that sends messages to the stream of your choice
    auto spotflow_exporter = std::make_unique<SpotflowMetricExporter>(
        client_holder,
        "my-new-stream-group",                                              // stream_group
        "my-new-stream",                                                    // stream
        opentelemetry::sdk::metrics::AggregationTemporality::kCumulative);

    // Set up the periodic exporting metric reader
    opentelemetry::sdk::metrics::PeriodicExportingMetricReaderOptions options;
    options.export_interval_millis = std::chrono::milliseconds(1000);
    options.export_timeout_millis = std::chrono::milliseconds(500);
    auto metric_reader = opentelemetry::sdk::metrics::PeriodicExportingMetricReaderFactory::Create(std::move(spotflow_exporter), options);

    // Set up the meter provider with the metric reader
    auto meter_provider_sdk = opentelemetry::sdk::metrics::MeterProviderFactory::Create();
    meter_provider_sdk->AddMetricReader(std::move(metric_reader));

    // Register the meter provider globally
    auto meter_provider = std::shared_ptr<opentelemetry::metrics::MeterProvider>(std::move(meter_provider_sdk));
    opentelemetry::metrics::Provider::SetMeterProvider(meter_provider);

    // Get a meter from the provider
    auto meter = meter_provider->GetMeter("custom-meter");

    // Create a counter instrument
    auto counter = meter->CreateUInt64Counter("counter");

    // Record metrics in a loop
    for (int i = 0; i < 15; i++)
    {
        counter->Add(1);
        Sleep(1000);
    }

    return 0;
}
Note that there are only three concepts specific to the Spotflow IoT Platform in the code:
- The class
SpotflowClientHolderis a C++ wrapper around the pointer tospotflow_client_t. It makes it easier to manage the lifetime of the client. The code wraps it instd::shared_ptrso that it can be used from multiple places (for example, from different exporters). - The class
SpotflowMetricExporterreferences the instance ofSpotflowClientHolder, and it also initializes a pointer tospotflow_message_context_t. This message context must be configured to send messages into the stream that is routed to your OpenTelemetry egress sink. - The
Exportmethod sends the data using the aforementionedspotflow_client_tandspotflow_message_context_tpointers. Remember, that the telemetry data must be encoded in the binary Protobuf format. In the example this is achieved with the OpenTelemetry SDK. Lastly, it's important to note that thebatch_slice_idparameter needs to be set tometricsin this case.
Run Program
Download the C++ file above into the send_otel_data folder as send_otel_data.cpp.
Replace the placeholder <Your Provisioning Token> with your Provisioning Token, enter your Stream Group and Stream, and compile the program:
mkdir build
cd build
cmake ..
cmake --build .
Run the compiled program:
- Windows
- Linux
./Debug/send_otel_data.exe
./send_otel_data
spotflow_client_start will display the Provisioning Operation ID and Verification Code:
Provisioning operation initialized, waiting for approval.
Operation ID: eb82df7f-63ab-429f-80df-f0ae05f57306
Verification Code: 3cwz1g1c
After you approve the operation in the next step, the Device will start sending metrics to the Platform.
Your telemetry data can be exported from your Device's program with the help of the standard OpenTelemetry SDK. Specifically, we recommend creating a custom metric exporter. This allows you to instrument your Device's program in the standard way, and the telemetry signals will be automatically routed to your observability backend.
Obtain Dependencies
Run the following commands to create a new Rust project and add the necessary dependencies on the Device SDK and OpenTelemetry SDK:
cargo new send_otel_data --bin
cd send_otel_data
cargo add async_trait opentelemetry prost spotflow tokio
cargo add opentelemetry-proto --features=gen-tonic-messages,metrics
cargo add opentelemetry_sdk --features=rt-tokio
Create Custom OTEL Exporter
You can create a custom OTEL exporter by implementing the opentelemetry_sdk::metrics::exporter::PushMetricExporter trait.
To start collecting metrics using the custom exporter, you need to create a metric reader and pass it to your SdkMeterProvider.
Take a look at the following simple implementation:
use std::{thread, time::Duration};

use async_trait::async_trait;
use opentelemetry::{global, metrics::MetricsError};
use opentelemetry_proto::tonic::collector::metrics::v1::ExportMetricsServiceRequest;
use opentelemetry_sdk::{
    metrics::{
        data::{ResourceMetrics, Temporality},
        exporter::PushMetricsExporter,
        reader::{
            AggregationSelector, DefaultAggregationSelector, DefaultTemporalitySelector,
            TemporalitySelector,
        },
        Aggregation, InstrumentKind, PeriodicReader, SdkMeterProvider,
    },
    runtime,
};
use prost::Message;
use spotflow::{DeviceClient, DeviceClientBuilder, MessageContext};
use tokio::task;

struct SpotflowMetricExporter {
    pub client: DeviceClient,
    pub message_context: MessageContext,
}

#[async_trait]
impl PushMetricsExporter for SpotflowMetricExporter {
    async fn export(&self, metrics: &mut ResourceMetrics) -> Result<(), MetricsError> {
        println!("Sending metrics.");

        // Serialize the metrics to a Protobuf message
        let req: ExportMetricsServiceRequest = (&*metrics).into();

        let client = self.client.clone();
        let message_context = self.message_context.clone();

        // Needed because DeviceClient and OTEL SDK run in different Tokio runtimes
        task::spawn_blocking(move || {
            // Send the serialized message to the Platform
            client.send_message_advanced(
                &message_context,
                None,                          // batch_id
                Some(String::from("metrics")), // batch_slice_id
                None,                          // message_id
                None,                          // chunk_id
                req.encode_to_vec(),
            )
        })
        .await
        .unwrap()
        .map_err(|e| MetricsError::Other(e.to_string()))
    }

    async fn force_flush(&self) -> Result<(), MetricsError> {
        Ok(())
    }

    fn shutdown(&self) -> Result<(), MetricsError> {
        Ok(())
    }
}

impl AggregationSelector for SpotflowMetricExporter {
    fn aggregation(&self, kind: InstrumentKind) -> Aggregation {
        DefaultAggregationSelector::new().aggregation(kind)
    }
}

impl TemporalitySelector for SpotflowMetricExporter {
    fn temporality(&self, kind: InstrumentKind) -> Temporality {
        DefaultTemporalitySelector::new().temporality(kind)
    }
}

fn main() {
    // Connect to the Platform (starts Device Provisioning if the Device is not already registered)
    let client = DeviceClientBuilder::new(
        Some(String::from("my-device")),
        String::from("<Your Provisioning Token>"),
        "spotflow.db",
    )
    .build()
    .expect("Unable to connect to the platform.");

    // Create a message context for sending messages to the stream of your choice
    let message_context = MessageContext::new(
        Some(String::from("my-new-stream-group")),
        Some(String::from("my-new-stream")),
    );

    // Since the DeviceClient uses its own Tokio runtime, we need to create a new one for OTEL
    let runtime = tokio::runtime::Runtime::new().unwrap();
    runtime.block_on(async {
        // Initialize the custom exporter
        let spotflow_exporter = SpotflowMetricExporter {
            client,
            message_context,
        };

        // Set up the periodic exporting metric reader
        let metric_reader = PeriodicReader::builder(spotflow_exporter, runtime::Tokio)
            .with_interval(Duration::from_secs(1))
            .build();

        // Set up the meter provider with the metric reader
        let meter_provider = SdkMeterProvider::builder()
            .with_reader(metric_reader)
            .build();

        // Register the meter provider globally
        global::set_meter_provider(meter_provider.clone());

        // Get a meter from the provider
        let meter = global::meter("custom-meter");

        // Create a counter instrument
        let counter = meter.u64_counter("counter").init();

        // Record metrics in a loop
        for _ in 0..15 {
            counter.add(1, &[]);
            thread::sleep(std::time::Duration::from_secs(1));
        }
    });
}
Note that there are only two concepts specific to the Spotflow IoT Platform in the code:
- The struct
SpotflowMetricExporterrequires instances ofDeviceClientandMessageContextin its constructor. This message context must be configured to send messages into the stream that is routed to your OpenTelemetry egress sink. - The
exportmethod sends the data using the aforementionedDeviceClientandMessageContextinstances. Remember that the telemetry data must be encoded in the binary Protobuf format. In the example, this is achieved with the OpenTelemetry SDK. Lastly, it's important to note that thebatch_slice_idparameter needs to be set tometricsin this case.
Run Program
Paste the code above into a new file, or download it.
Replace the placeholder <Your Provisioning Token> with your Provisioning Token, enter your Stream Group and Stream, and run the program:
cargo run
DeviceClientBuilder::build will display the Provisioning Operation ID and Verification Code:
Provisioning operation initialized, waiting for approval.
Operation ID: eb82df7f-63ab-429f-80df-f0ae05f57306
Verification Code: 3cwz1g1c
After you approve the operation in the next step, the Device will start sending metrics to the Platform.
4. Approve Device
While the code on the Device side is still running, you'll now approve the Provisioning Operation started in the previous step:
- Portal
- CLI
- API
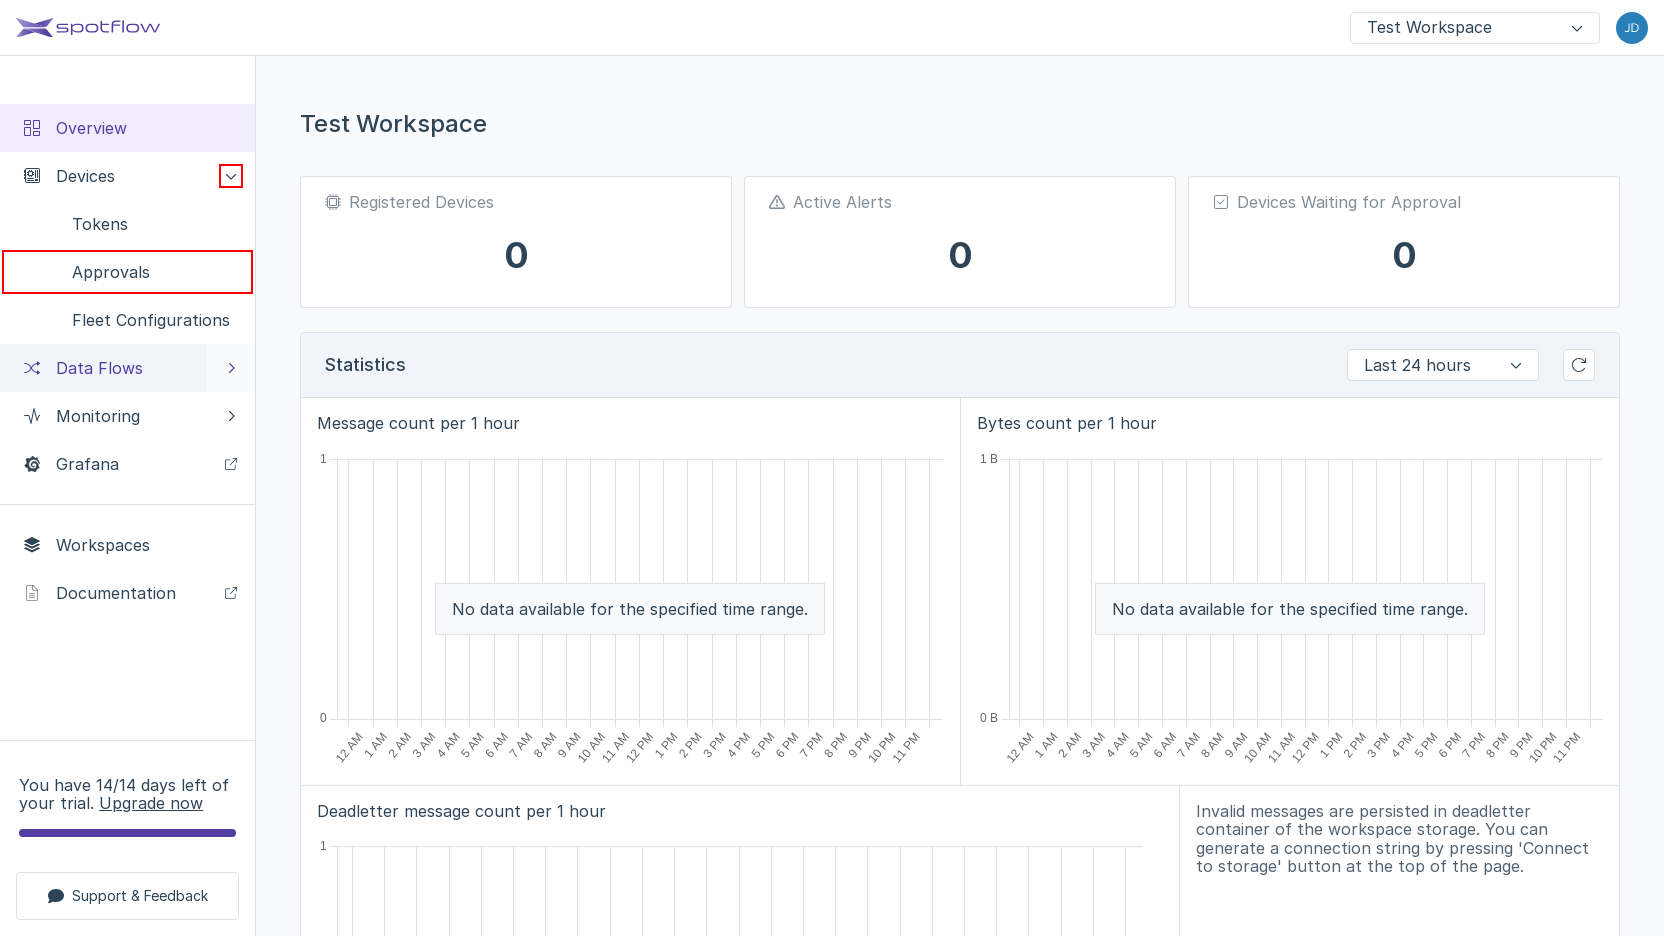

Expand the link Devices in the left sidebar if it's not already expanded. Open the link Approvals.
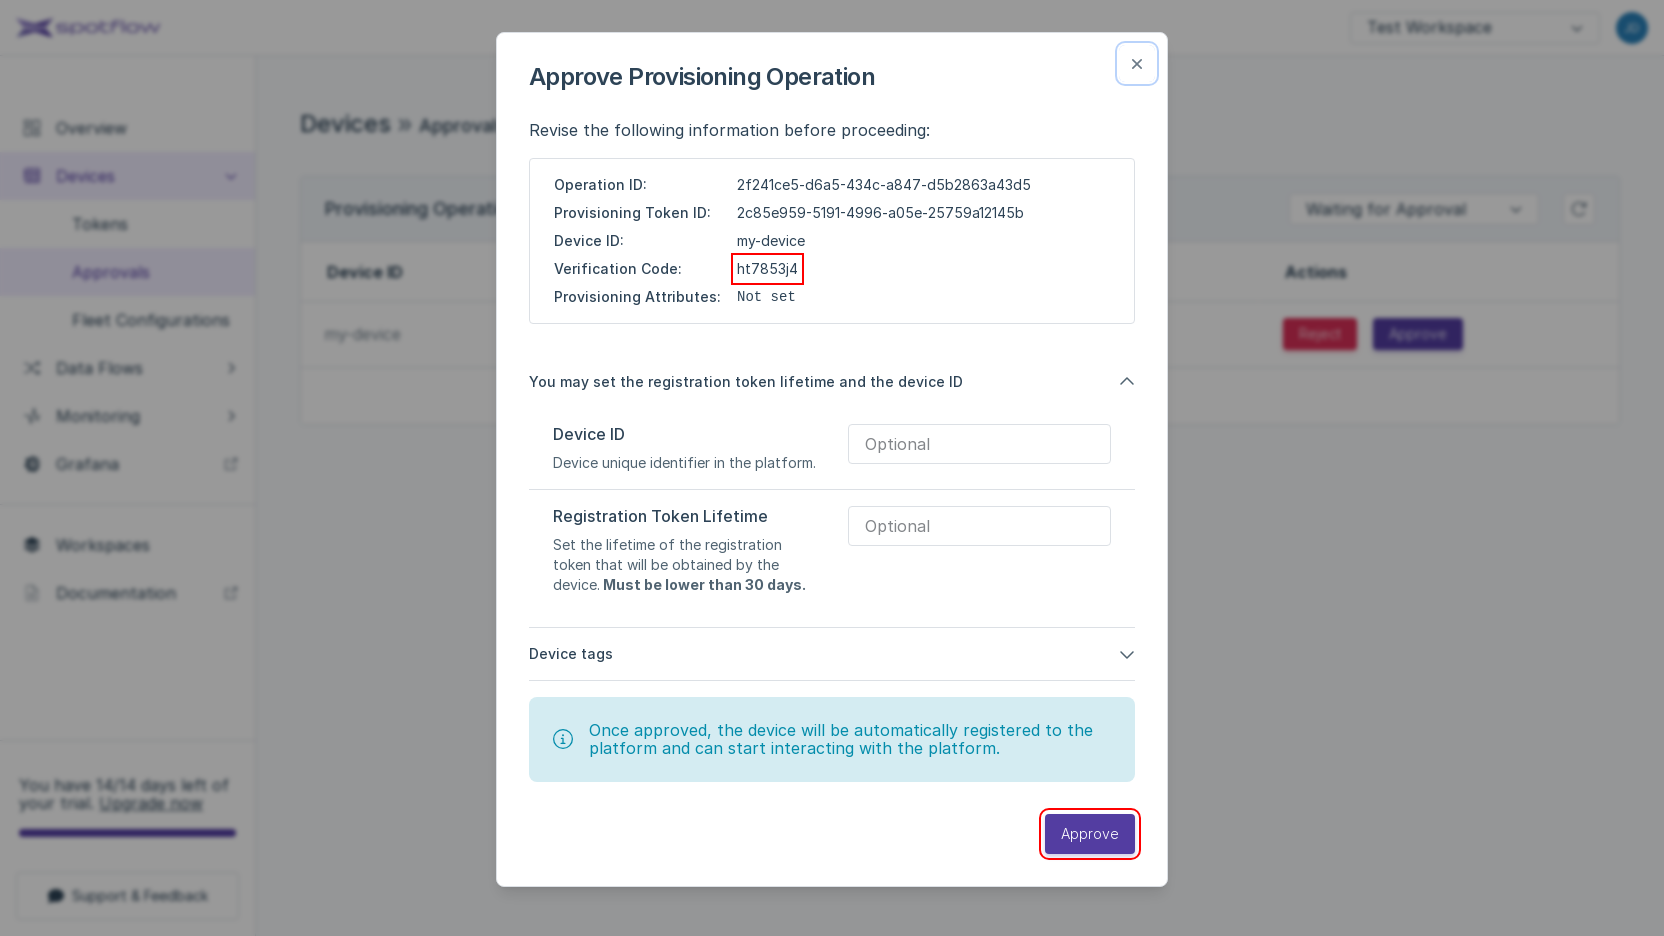
The list of Provisioning Operations opens. You should see a row with the Device ID
my-device. Click Approve in the column Actions.The approval dialog window shows the Provisioning Operation details and allows you to override Device registration details. Check the Verification Code, leave the default values and click Approve.
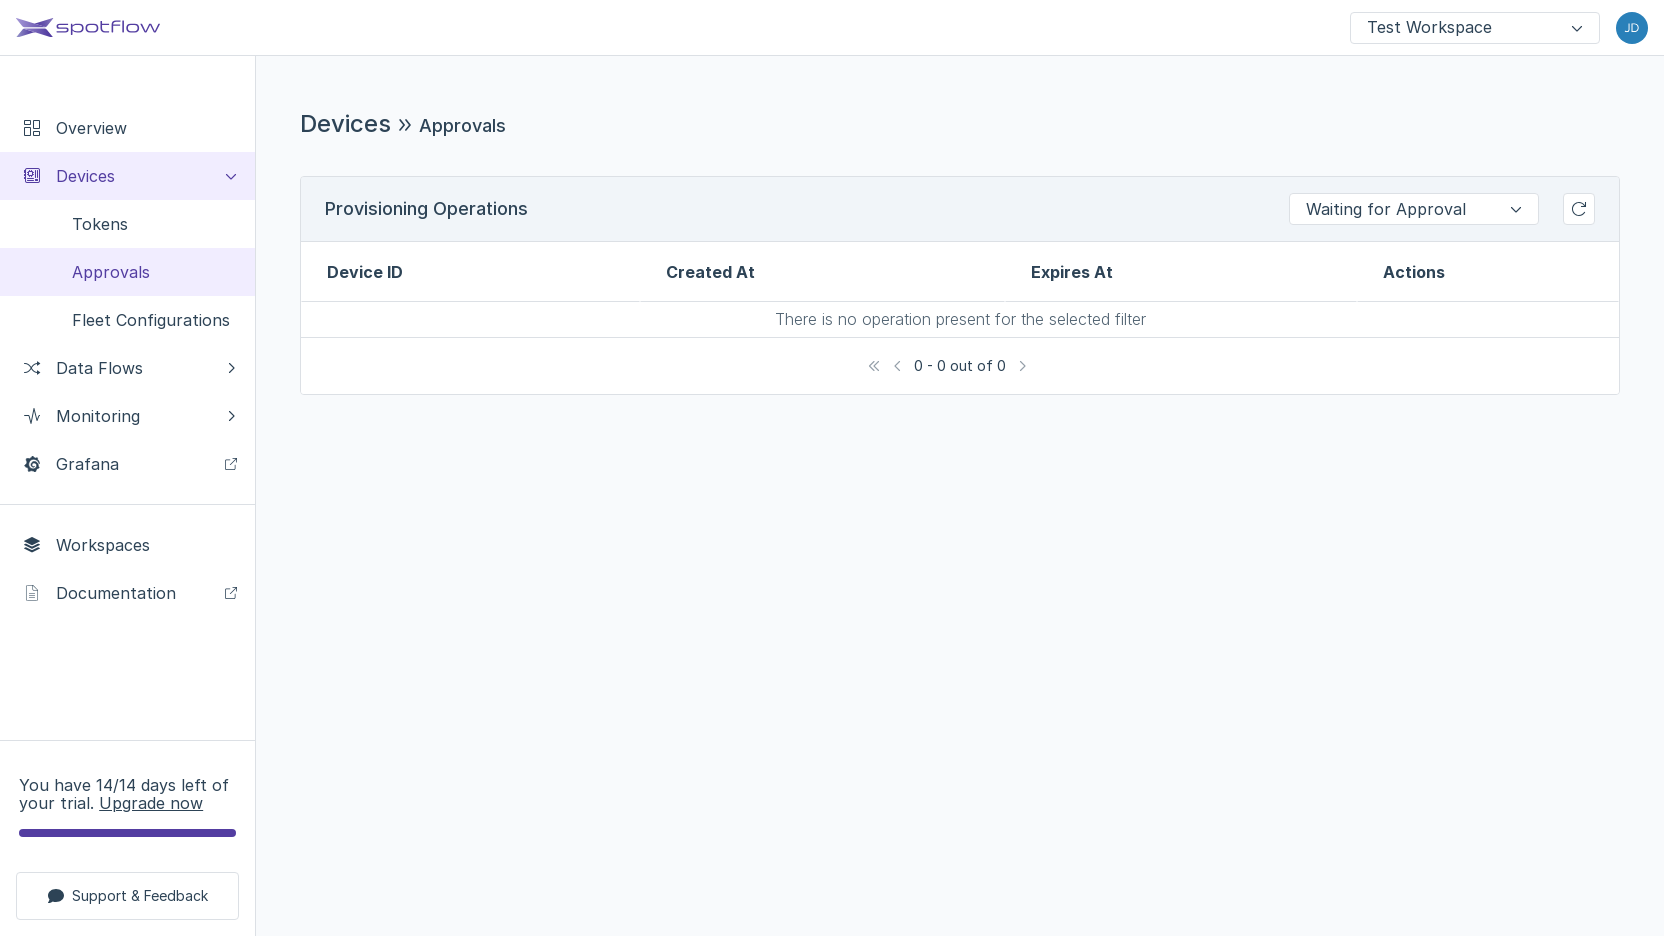
Good job! The Device disappeared from the table because its state changed to Approved, while the current filter shows only the Devices in the state Waiting for Approval.
The following instructions expect that you have already installed the CLI and logged in.
Run the following command in a different terminal window than where the Device SDK is running.
Replace the placeholder <Your Provisioning Operation ID> by the Operation ID you received from the Device in the previous step.
spotf provisioning-operation approve --provisioning-operation-id <Your Provisioning Operation ID>
The CLI will confirm the Provisioning Operation approval:
Provisioning operation 'b170c9ab-961c-4c02-af88-d4287d9cea1f' approved successfully.
The following instructions expect that you have already obtained the API access token from the Portal and that you know the Workspace ID.
Replace the placeholders <Your Workspace ID>, <Your API Access Token>, and <Your Provisioning Operation ID> with your Workspace ID, API access token, and Provisioning Operation ID and run the following command to approve the Provisioning Operation:
- cURL
- PowerShell
curl -X PUT 'https://api.eu1.spotflow.io/workspaces/<Your Workspace ID>/provisioning-operations/approve' \
 -H 'Content-Type: application/json' \
 -H 'Accept: application/json' \
 -H 'Authorization: Bearer <Your API Access Token>' \
 -d '{"provisioningOperationId": "<Your Provisioning Operation ID>"}' \
 -w "%{http_code}"
(Invoke-WebRequest -Method Put -Uri 'https://api.eu1.spotflow.io/workspaces/<Your Workspace ID>/provisioning-operations/approve' `
 -Headers @{
   'Content-Type' = 'application/json'
   'Accept' = 'application/json'
   'Authorization' = 'Bearer <Your API Access Token>'
 } `
 -Body '{"provisioningOperationId": "<Your Provisioning Operation ID>"}').StatusCode
The API will return the code 201 to confirm the approval.
Finally, if you look at the program output, you should see that the device is registered and started sending metrics:
Provisioning operation initialized, waiting for approval.
Operation ID: eb82df7f-63ab-429f-80df-f0ae05f57306
Verification Code: 3cwz1g1c
Sending metrics.
Sending metrics.
Sending metrics.
Sending metrics.
...
6. See Data in Grafana Cloud
The following text demonstrates how to visualize data in Grafana Cloud. Refer to the documentation of your observability backend if you use a different one from Grafana Cloud.
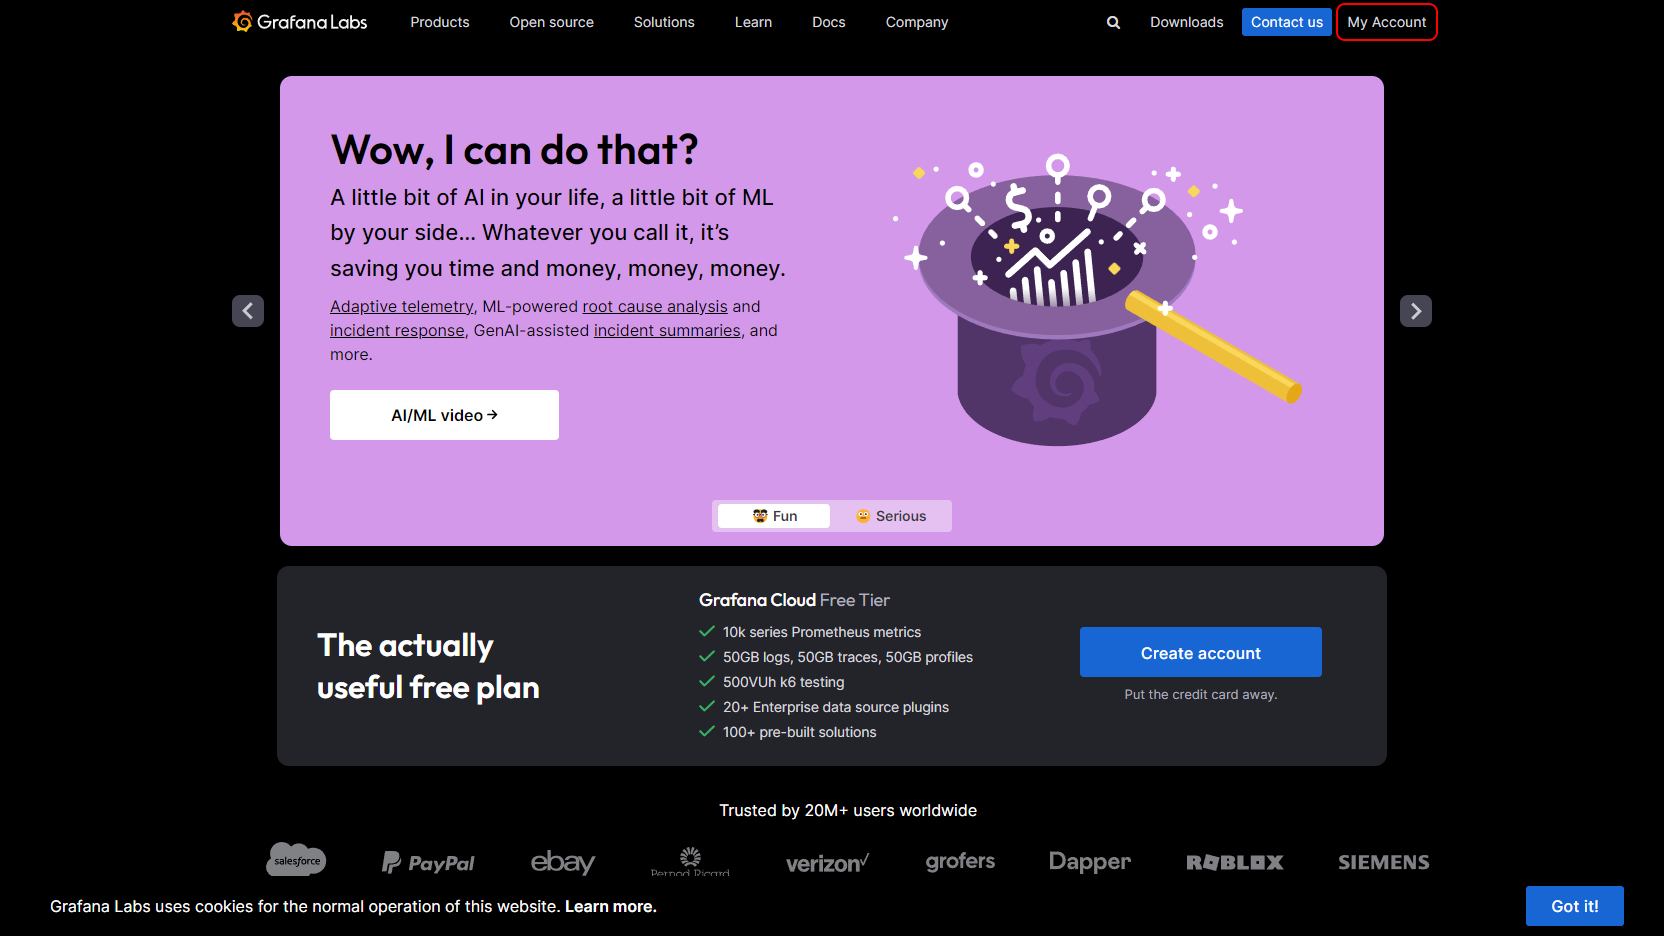
Go to https://grafana.com/ and click My Account (or sign in if you needed).
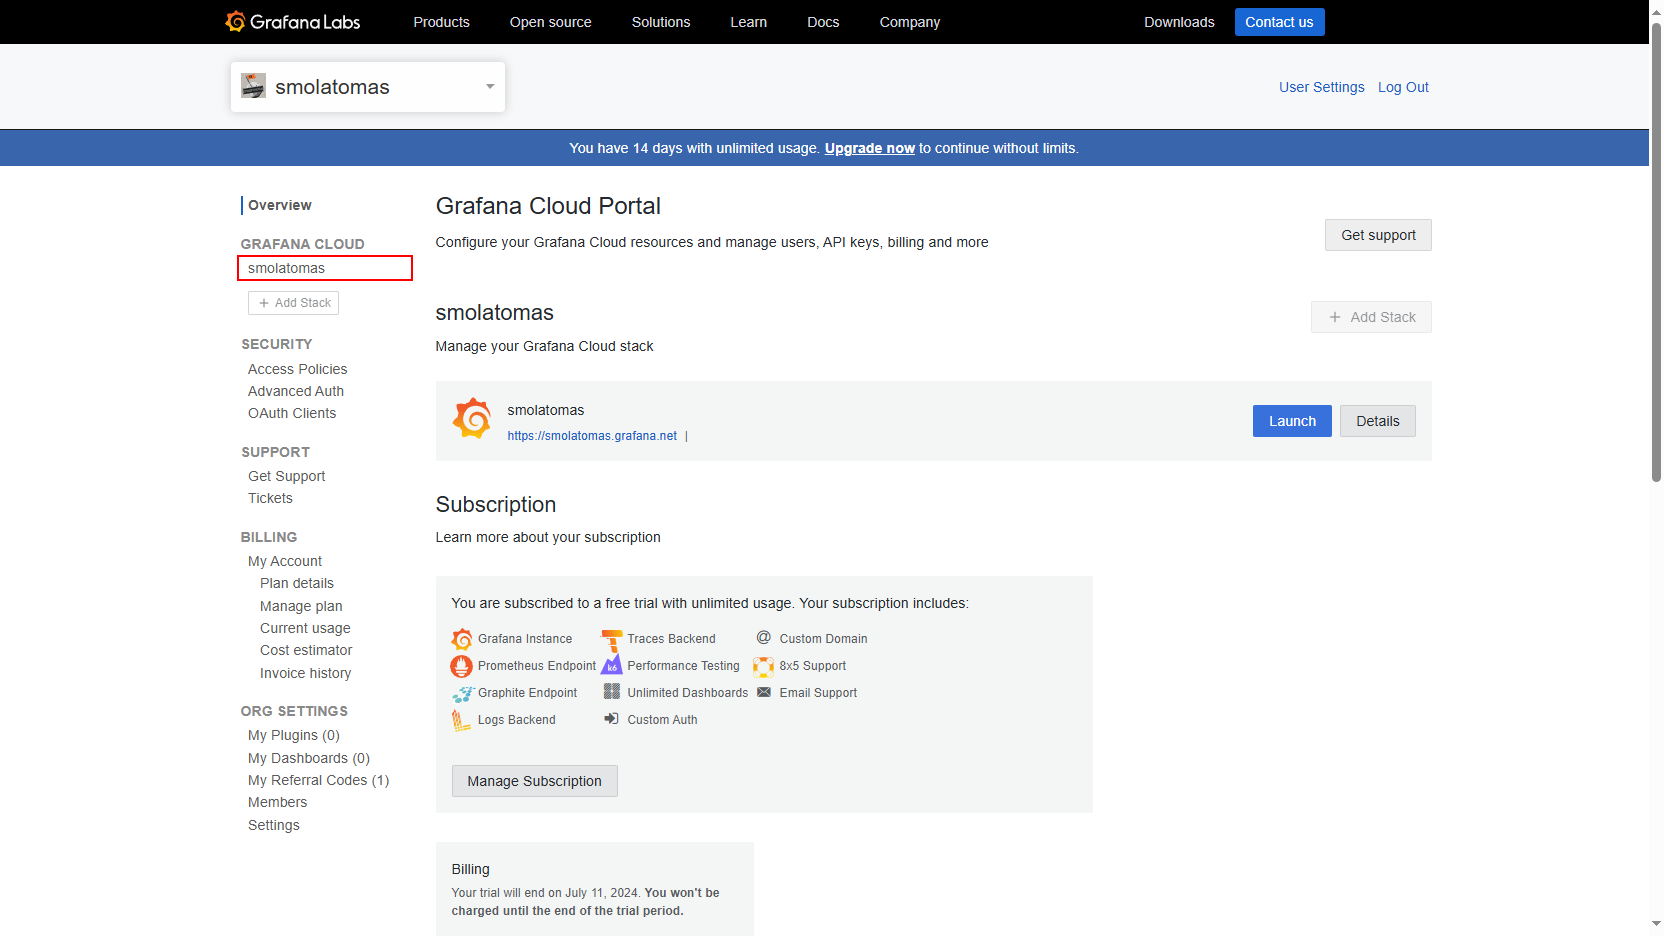
In the Grafana Cloud Portal, navigate to your stack by clicking on its name.
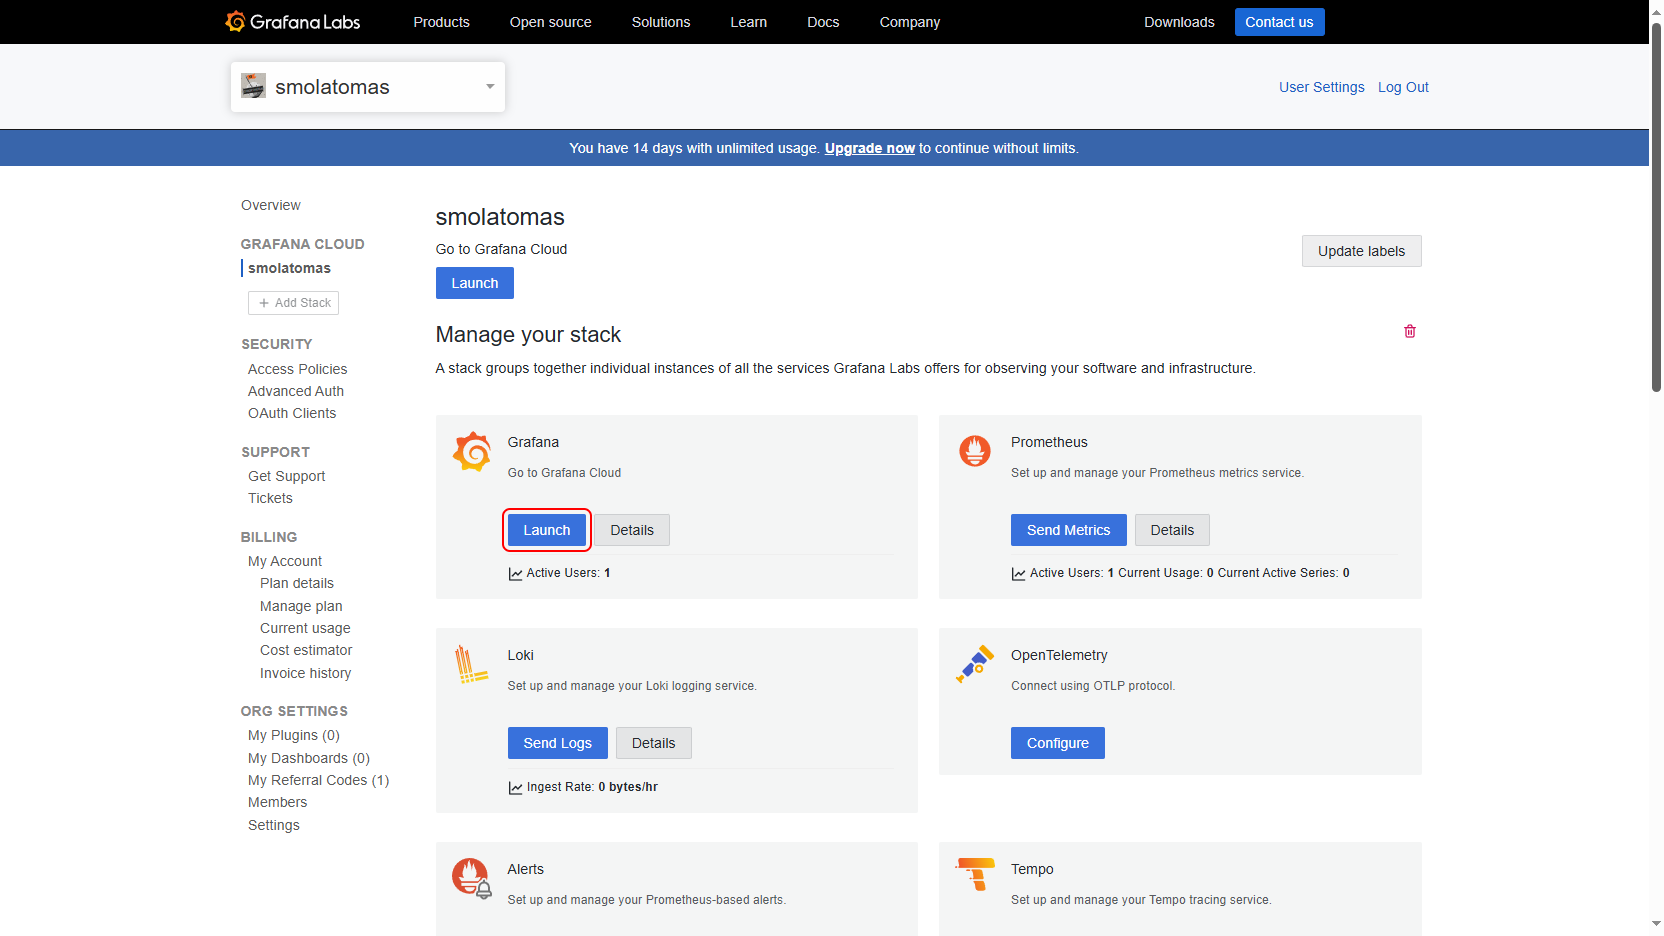
Click Launch in Grafana section. Grafana UI will open.
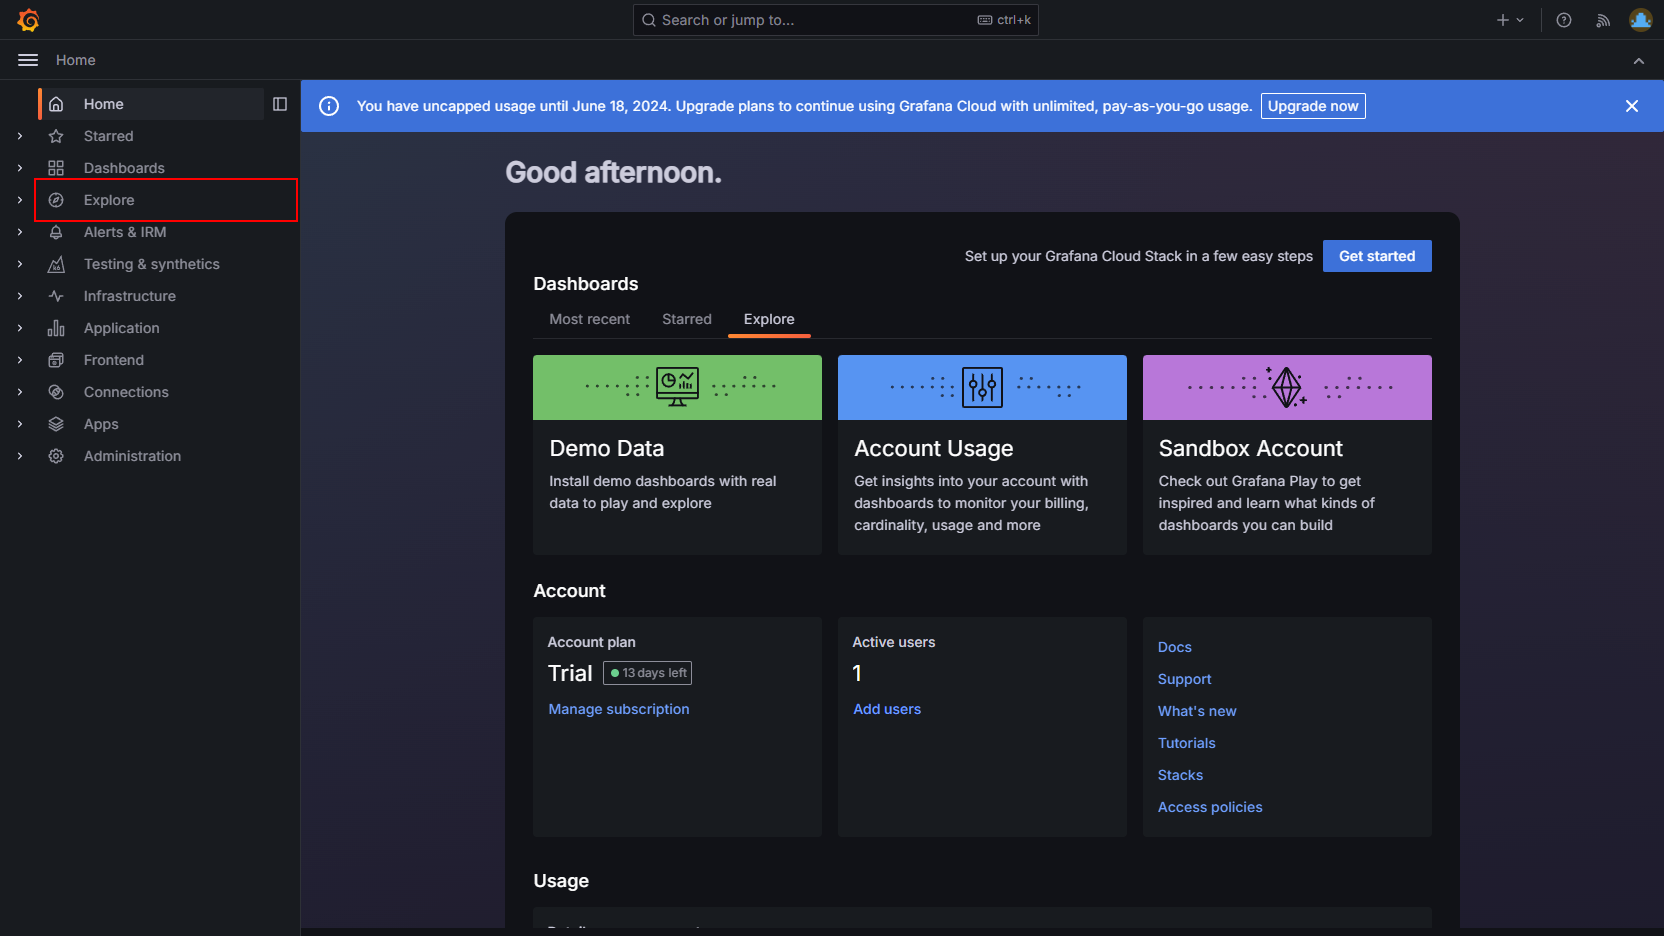
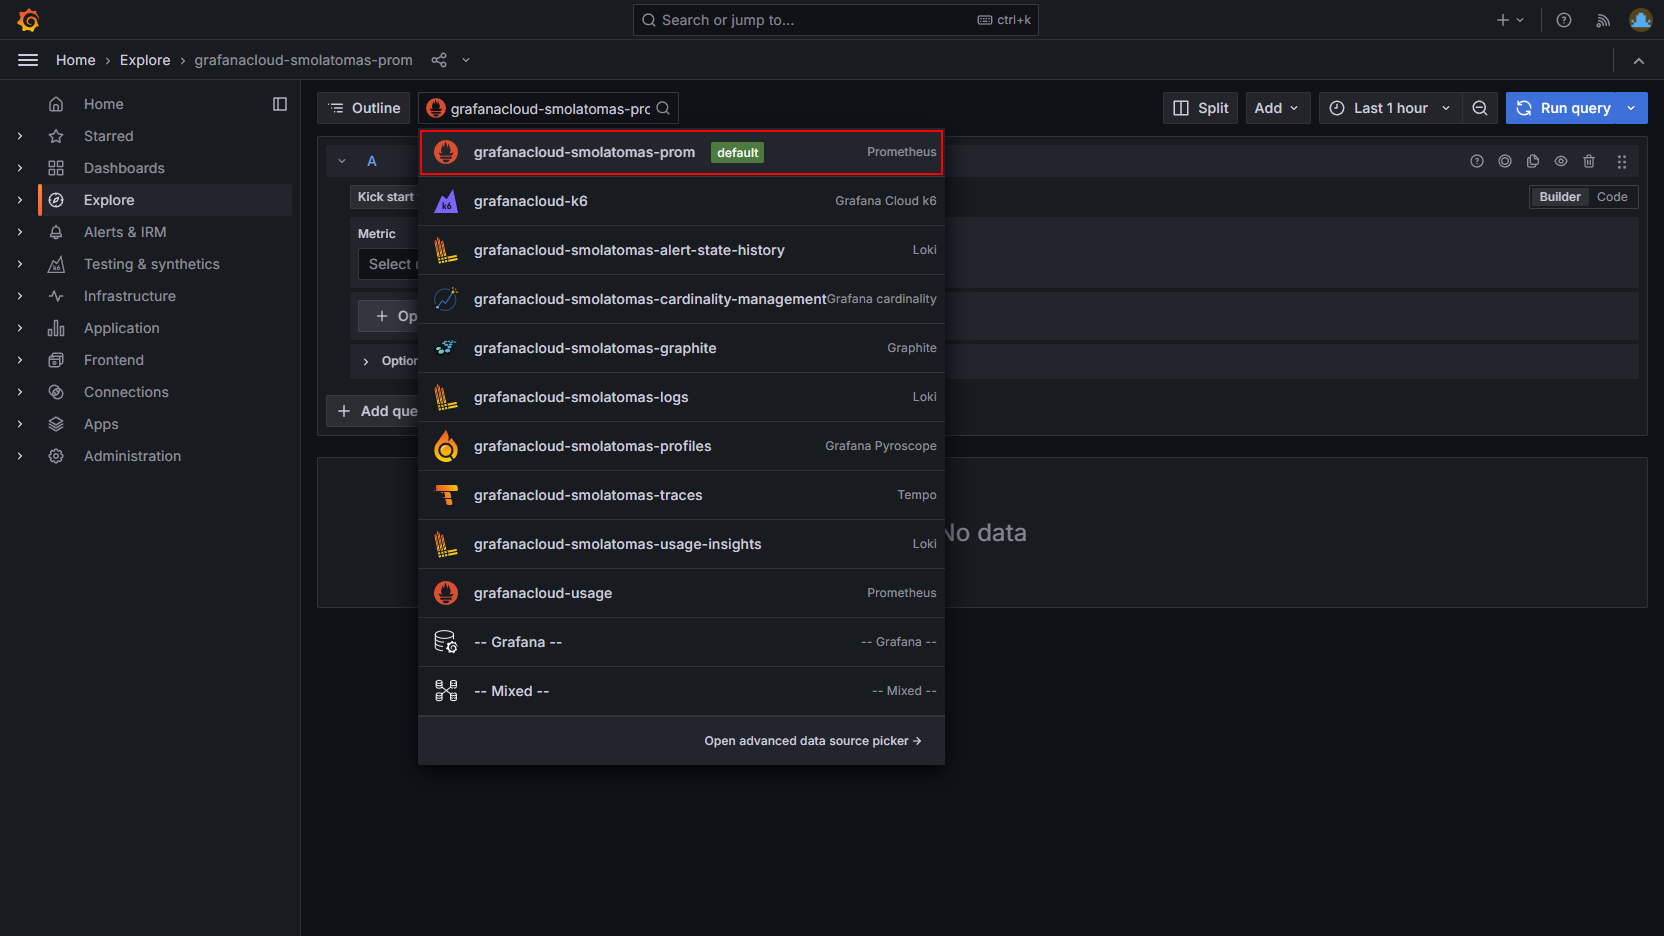
Click Explore in the left menu.
Select the Prometheus datasource, in this example it is called
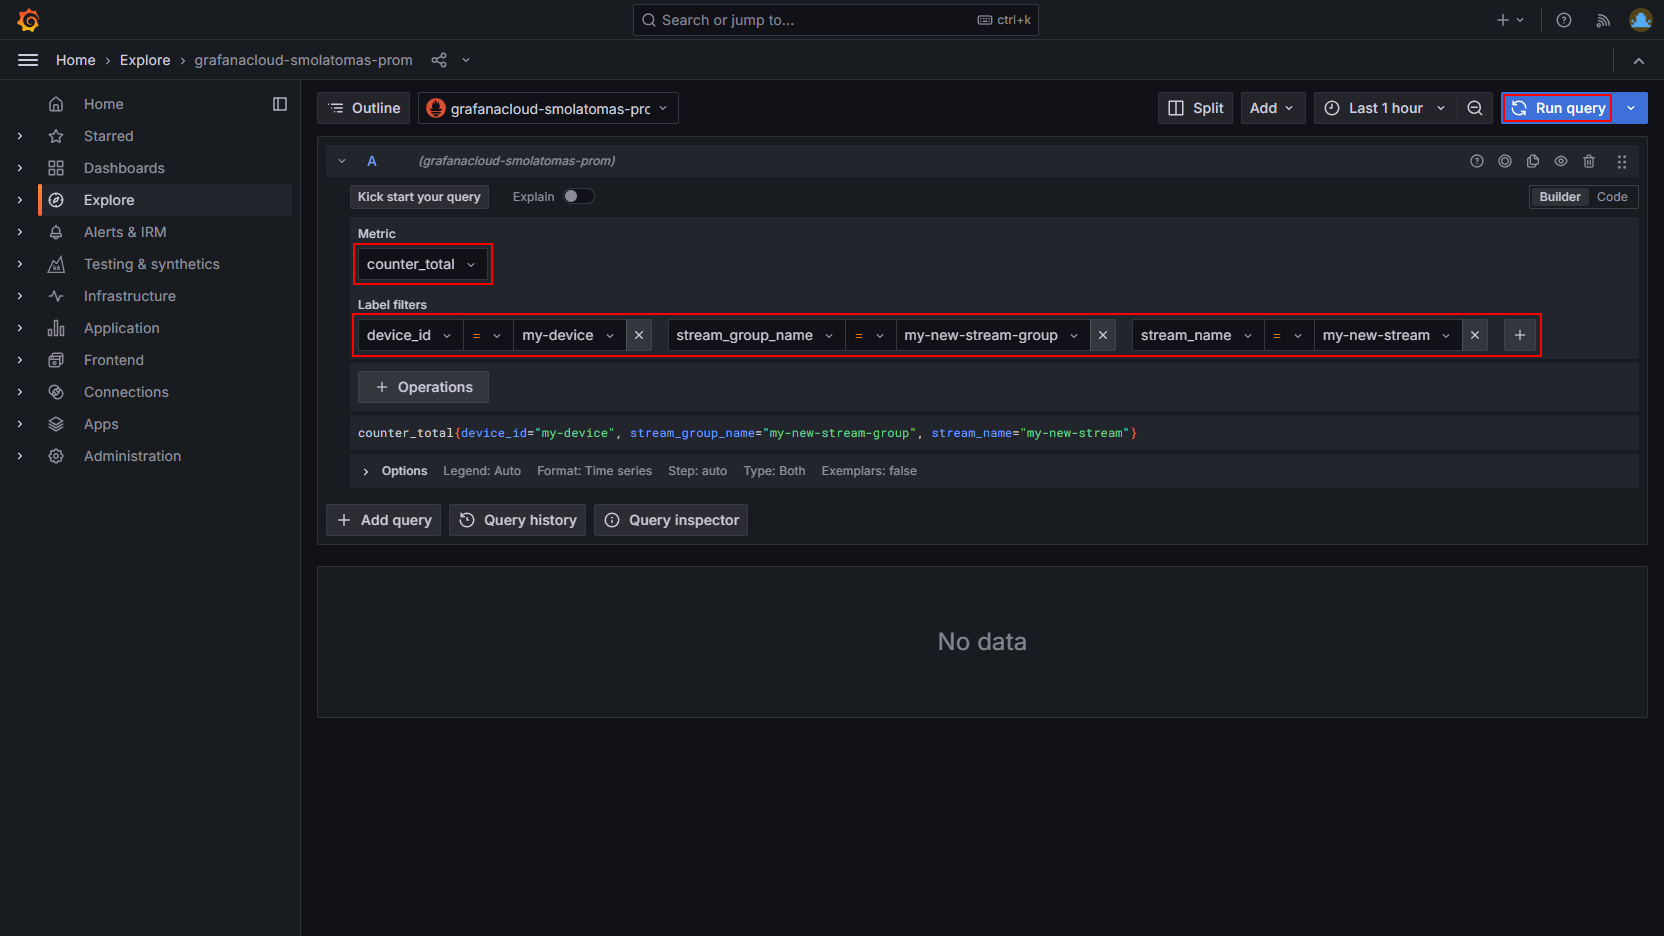
grafanacloud-smolatomas-prom.Select metric
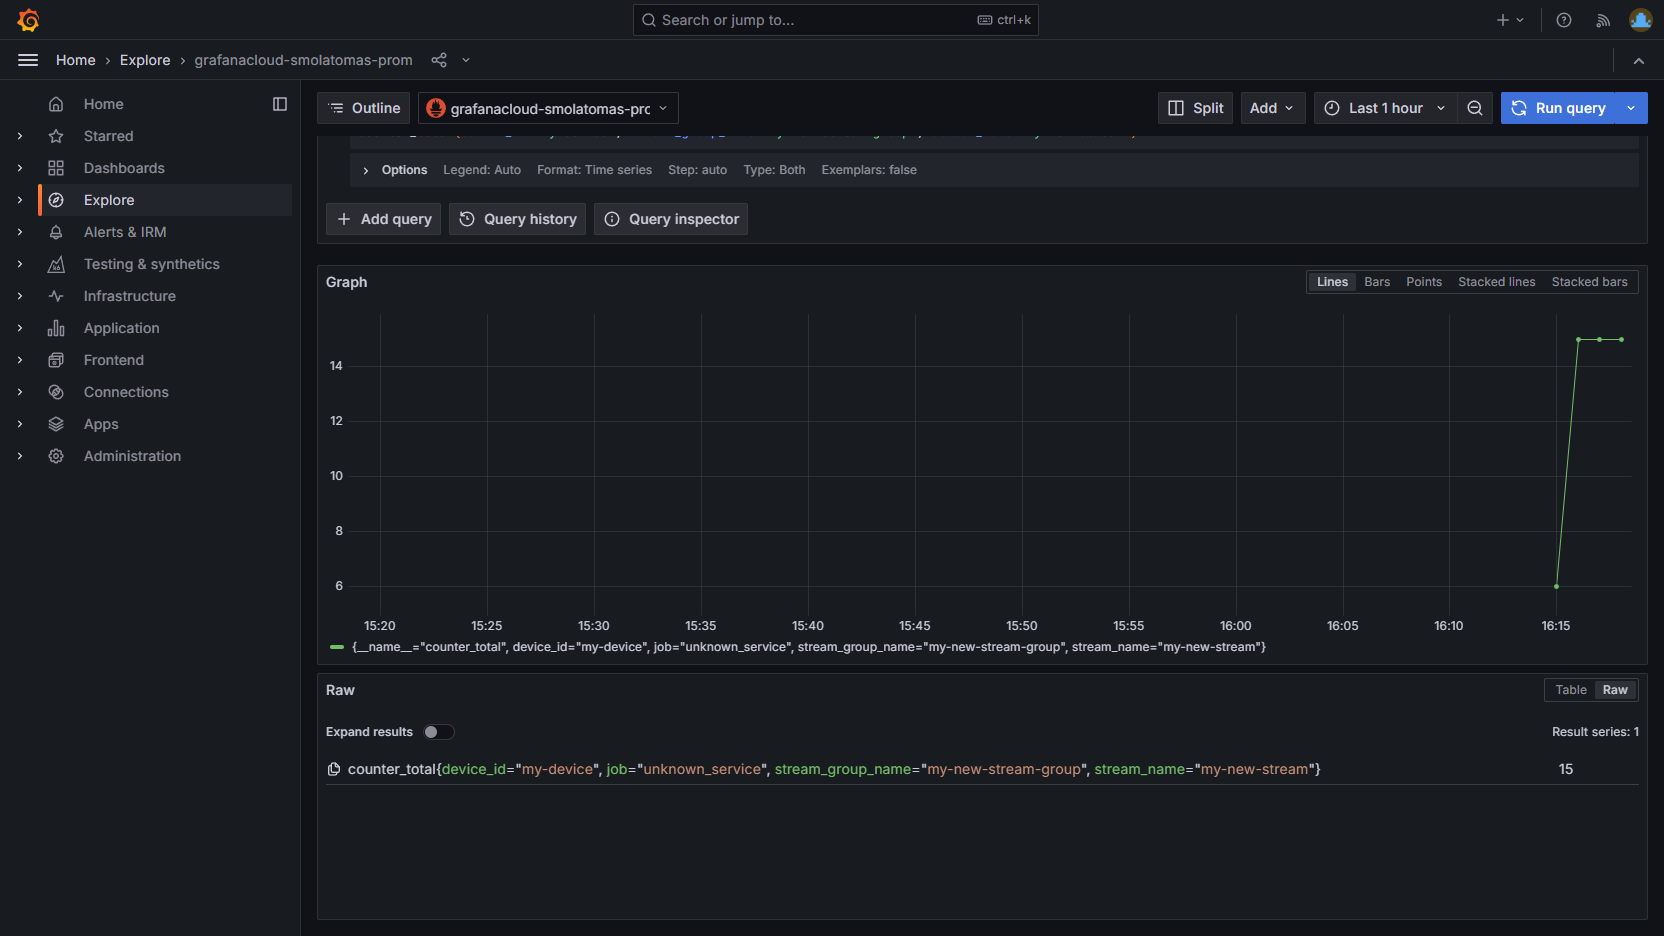
counter_totaland labels identifying data sent by your Device. Click Run query.Explore the counter metric sent by your Device through the Platform to Grafana Cloud.