Silicon Labs
Connect supported Silicon Labs boards to Spotflow over Bluetooth Low Energy or Wi-Fi.
The following tested Silicon Labs boards can connect to Spotflow through a Bluetooth Low Energy gateway or directly over Wi-Fi. Choose the transport that matches your board and application:
| Board | Zephyr board target | BLE | Wi-Fi |
|---|---|---|---|
| xG24 Explorer Kit (EFR32MG24) | xg24_ek2703a | Yes | NA |
| SiWx917 Dev Kit (BRD2605A) | siwx917_dk2605a | Yes | Yes |
The Spotflow Device SDK selects one Spotflow transport per firmware build. BLE sends data through a gateway (e.g the Spotflow Web App) and ingest key is provided by the gateway. Wi-Fi uses MQTT to connect directly to Spotflow and requires an ingest key (a secret used for authentication) to be configured in KConfig that can be found in the Spotflow Web App.
Bluetooth Low Energy
Use the Spotflow BLE transport to send logs, metrics, and crash reports through a gateway. The board acts as a BLE peripheral, while the gateway connects to Spotflow over MQTT.
BLE devices do not store a Spotflow ingest key. The gateway provides the ingest key and forwards data from the board to Spotflow. For development and testing, you can use the Spotflow Web App as the gateway.
Install prerequisites
Install the dependencies from the Zephyr Getting Started Guide, including Git and Python 3.10 or later.
You also need:
- A supported Silicon Labs board and a USB cable
- Flashing software supported by the board
- A computer with Bluetooth Low Energy support
- A Chromium-based browser with Web Bluetooth support to use the Spotflow Web App as a gateway
On Windows, use a short workspace path, such as C:\spotflow-ws, to avoid exceeding the maximum path length during the build.
Create a West workspace
Create a workspace using the Silicon Labs manifest from the Spotflow Device SDK. The manifest installs Zephyr and the required Silicon Labs HAL.
mkdir spotflow-ws
cd spotflow-ws
python3 -m venv .venv
source .venv/bin/activate
pip install west

west init \
  --manifest-url https://github.com/spotflow-io/device-sdk \
  --manifest-file zephyr/manifests/west-zephyr-silabs.yml \
  .
west update --fetch-opt=--depth=1 --narrow
west packages pip --install
west sdk install --version 1.0.1 --toolchains arm-zephyr-eabi

west blobs fetch hal_silabs
Configure the BLE sample
Replace the sample device ID in the configuration file for your board with an identifier that is unique within your Spotflow workspace:
CONFIG_SPOTFLOW_DEVICE_ID="<your-unique-device-id>"The sample already enables the BLE transport, logging, metrics, and crash reports:
CONFIG_SPOTFLOW=y
CONFIG_SPOTFLOW_TRANSPORT_BLE=y
CONFIG_SPOTFLOW_LOG_BACKEND=y
CONFIG_SPOTFLOW_METRICS=y
CONFIG_SPOTFLOW_COREDUMPS=y
Do not add CONFIG_SPOTFLOW_INGEST_KEY. Authentication is handled by the BLE gateway.
Build and flash the sample
Run the commands from <workspace>/modules/lib/spotflow/zephyr/samples/ble.
west build --pristine --board xg24_ek2703a .
west flash
The sample uses a 32 KiB in-memory crash-report backend on this board.
The SDK also contains boards/xg24_ek2703a-internal.overlay, which configures the radio for 20 dBm output and a 3.3 V PA supply. Do not apply this overlay unless those settings are correct for your exact hardware and permitted in your region.
Use the Spotflow Web App as a BLE Gateway
For development and testing, you can use Spotflow Web App as a BLE gateway. It connects to a BLE leaf device and forwards telemetry to Spotflow over MQTT.
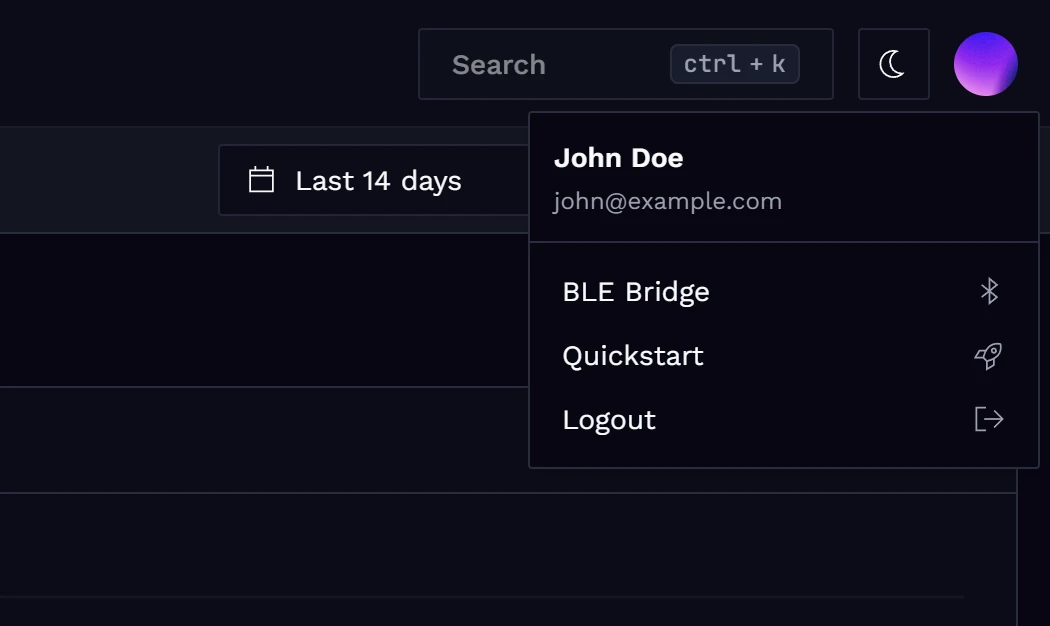
In the Spotflow Web Application, open the BLE Gateway page from the user menu in the top-right corner.
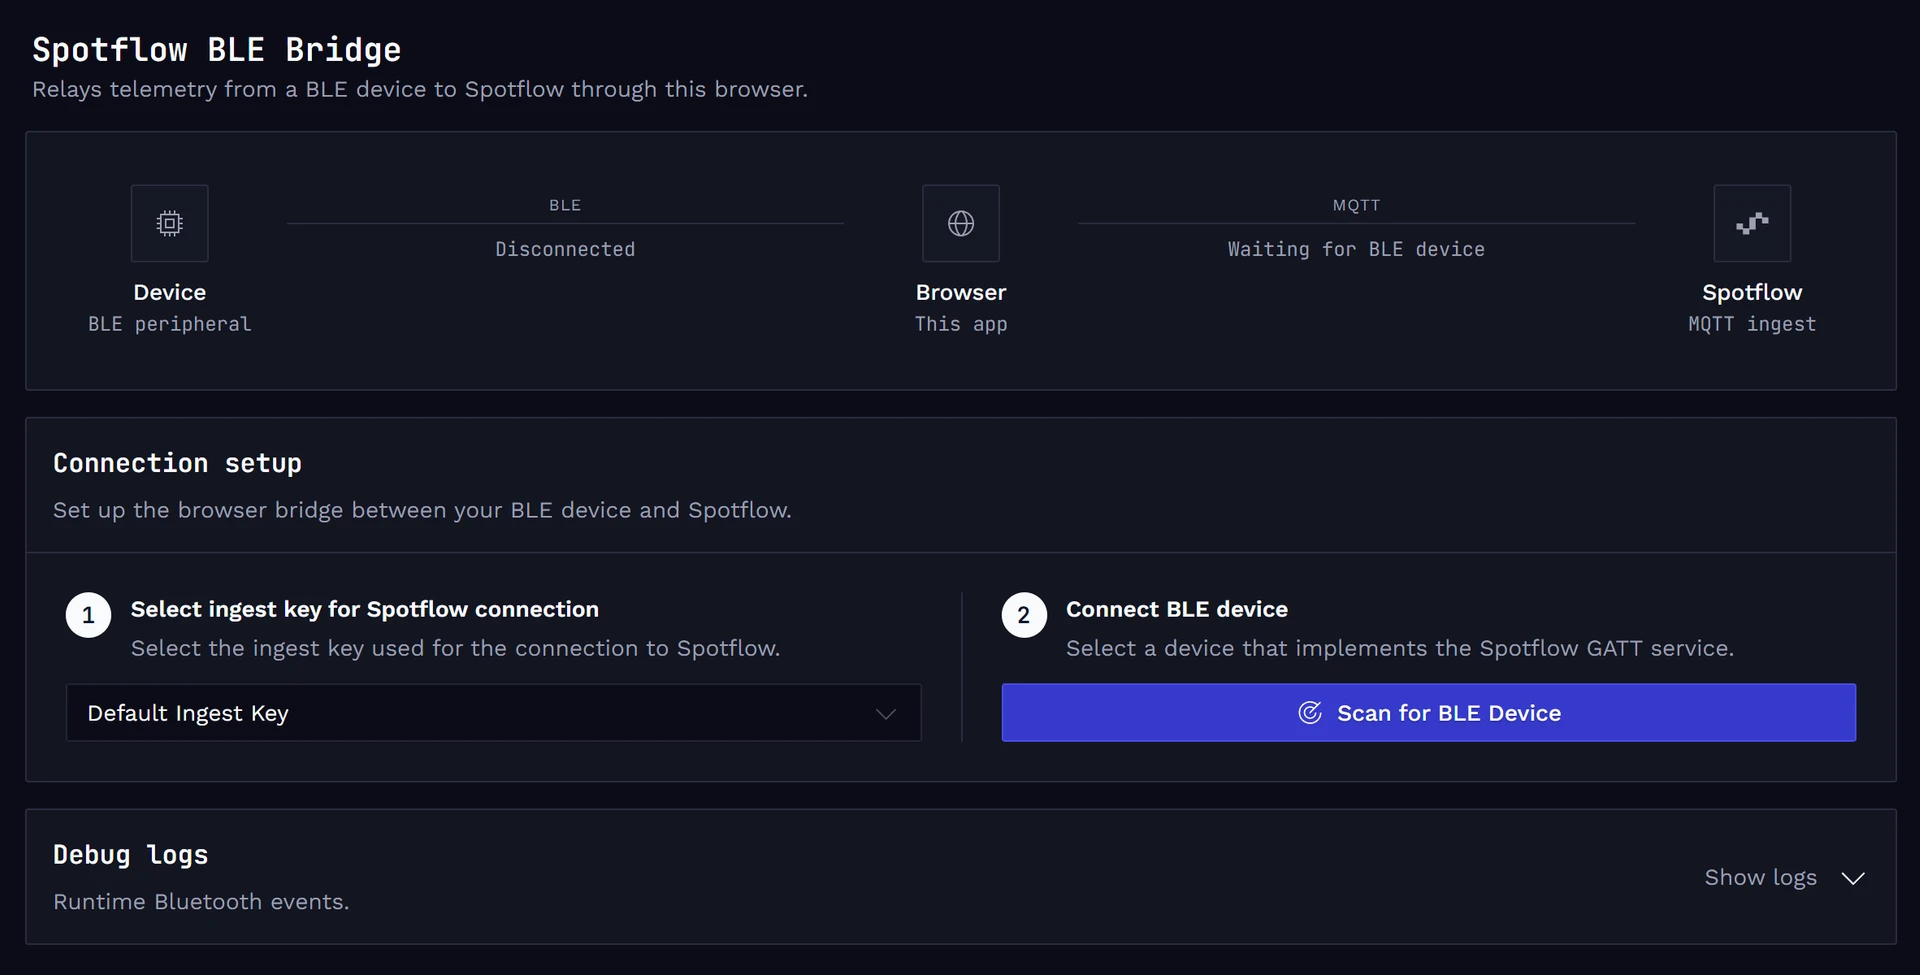
On the BLE Gateway page, select the Ingest key to use for the MQTT connection.
Then click Scan for BLE devices to find nearby BLE leaf devices advertising the Spotflow GATT service.
Select the device advertised as Spotflow EFR32MG24 or Spotflow SiLabs SIWX917. Keep the gateway page open while testing the integration.
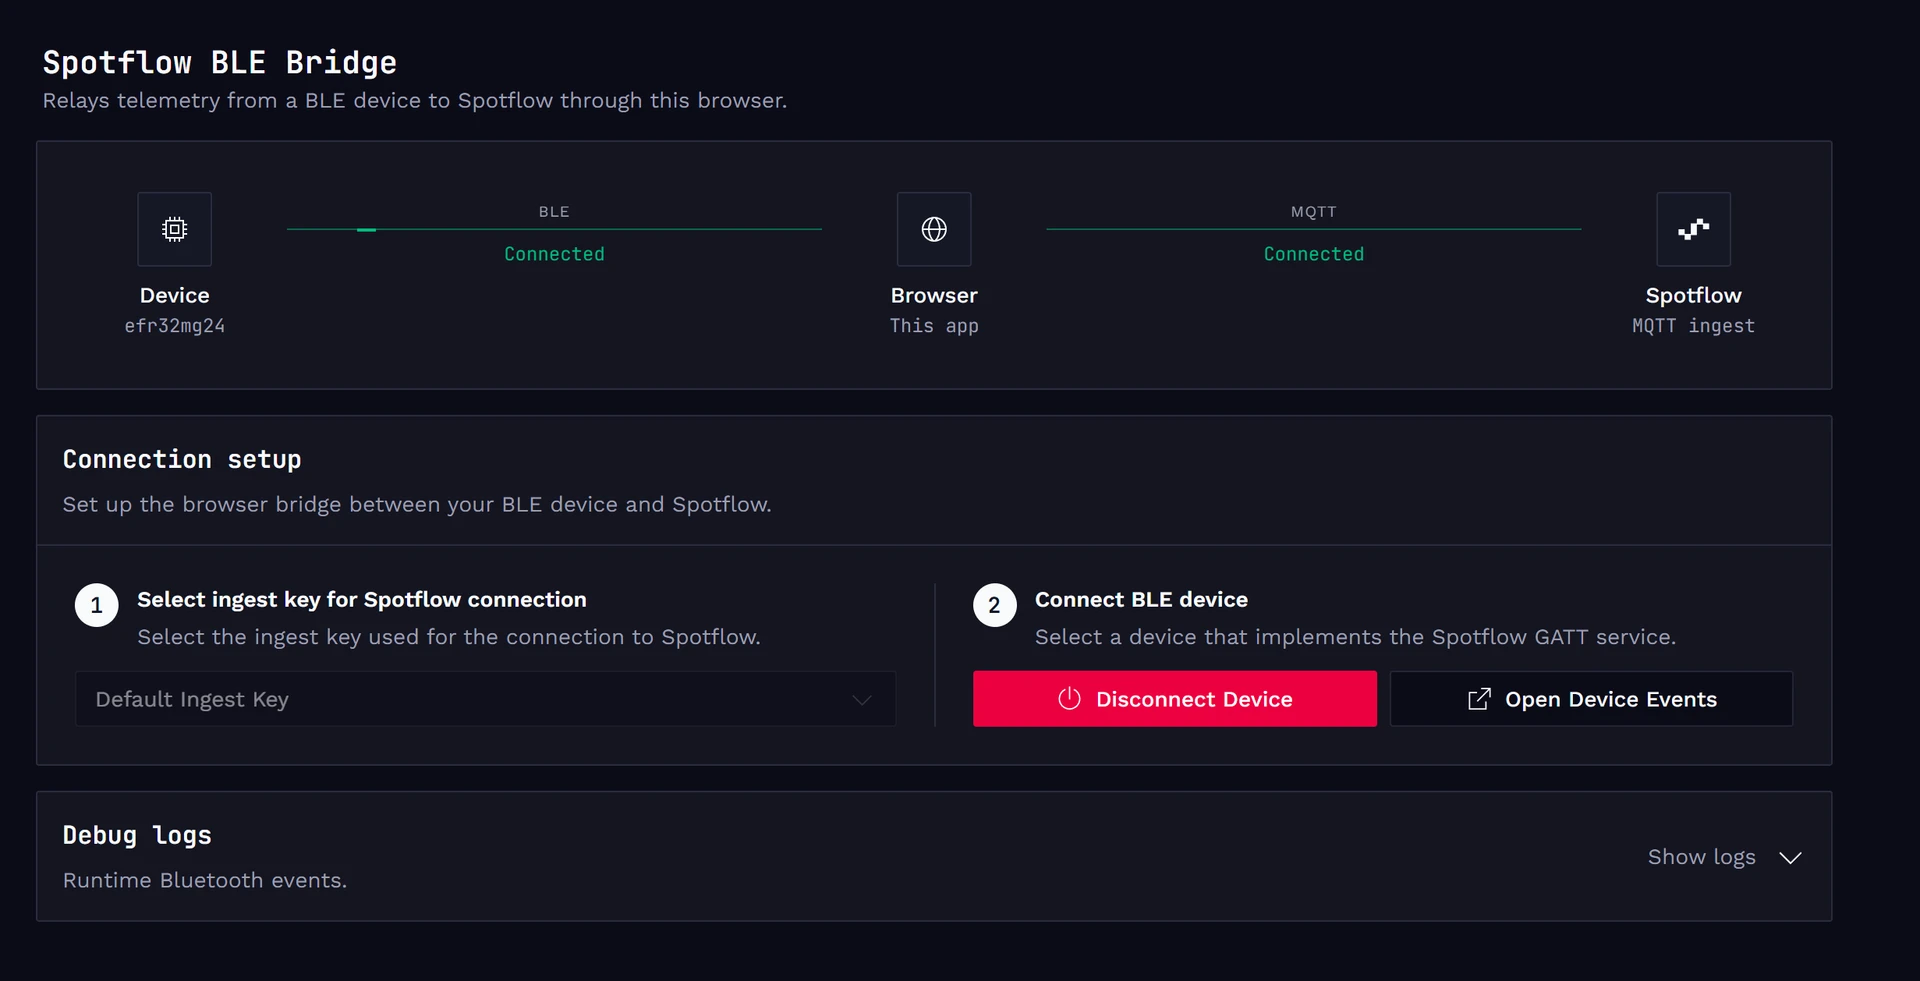
Select a device from the list to connect. Once connected, the browser forwards telemetry from the BLE device to Spotflow over MQTT.
This setup is intended for development and testing because the browser Bluetooth API provides limited control over the BLE stack.
The Spotflow Web App has to stay open in the browser to maintain the BLE connection. If you close the browser or navigate away from the page, the BLE connection is lost and the board cannot forward telemetry to Spotflow.
Use the button Open Device Events.
Analyze Logs in the Web Application
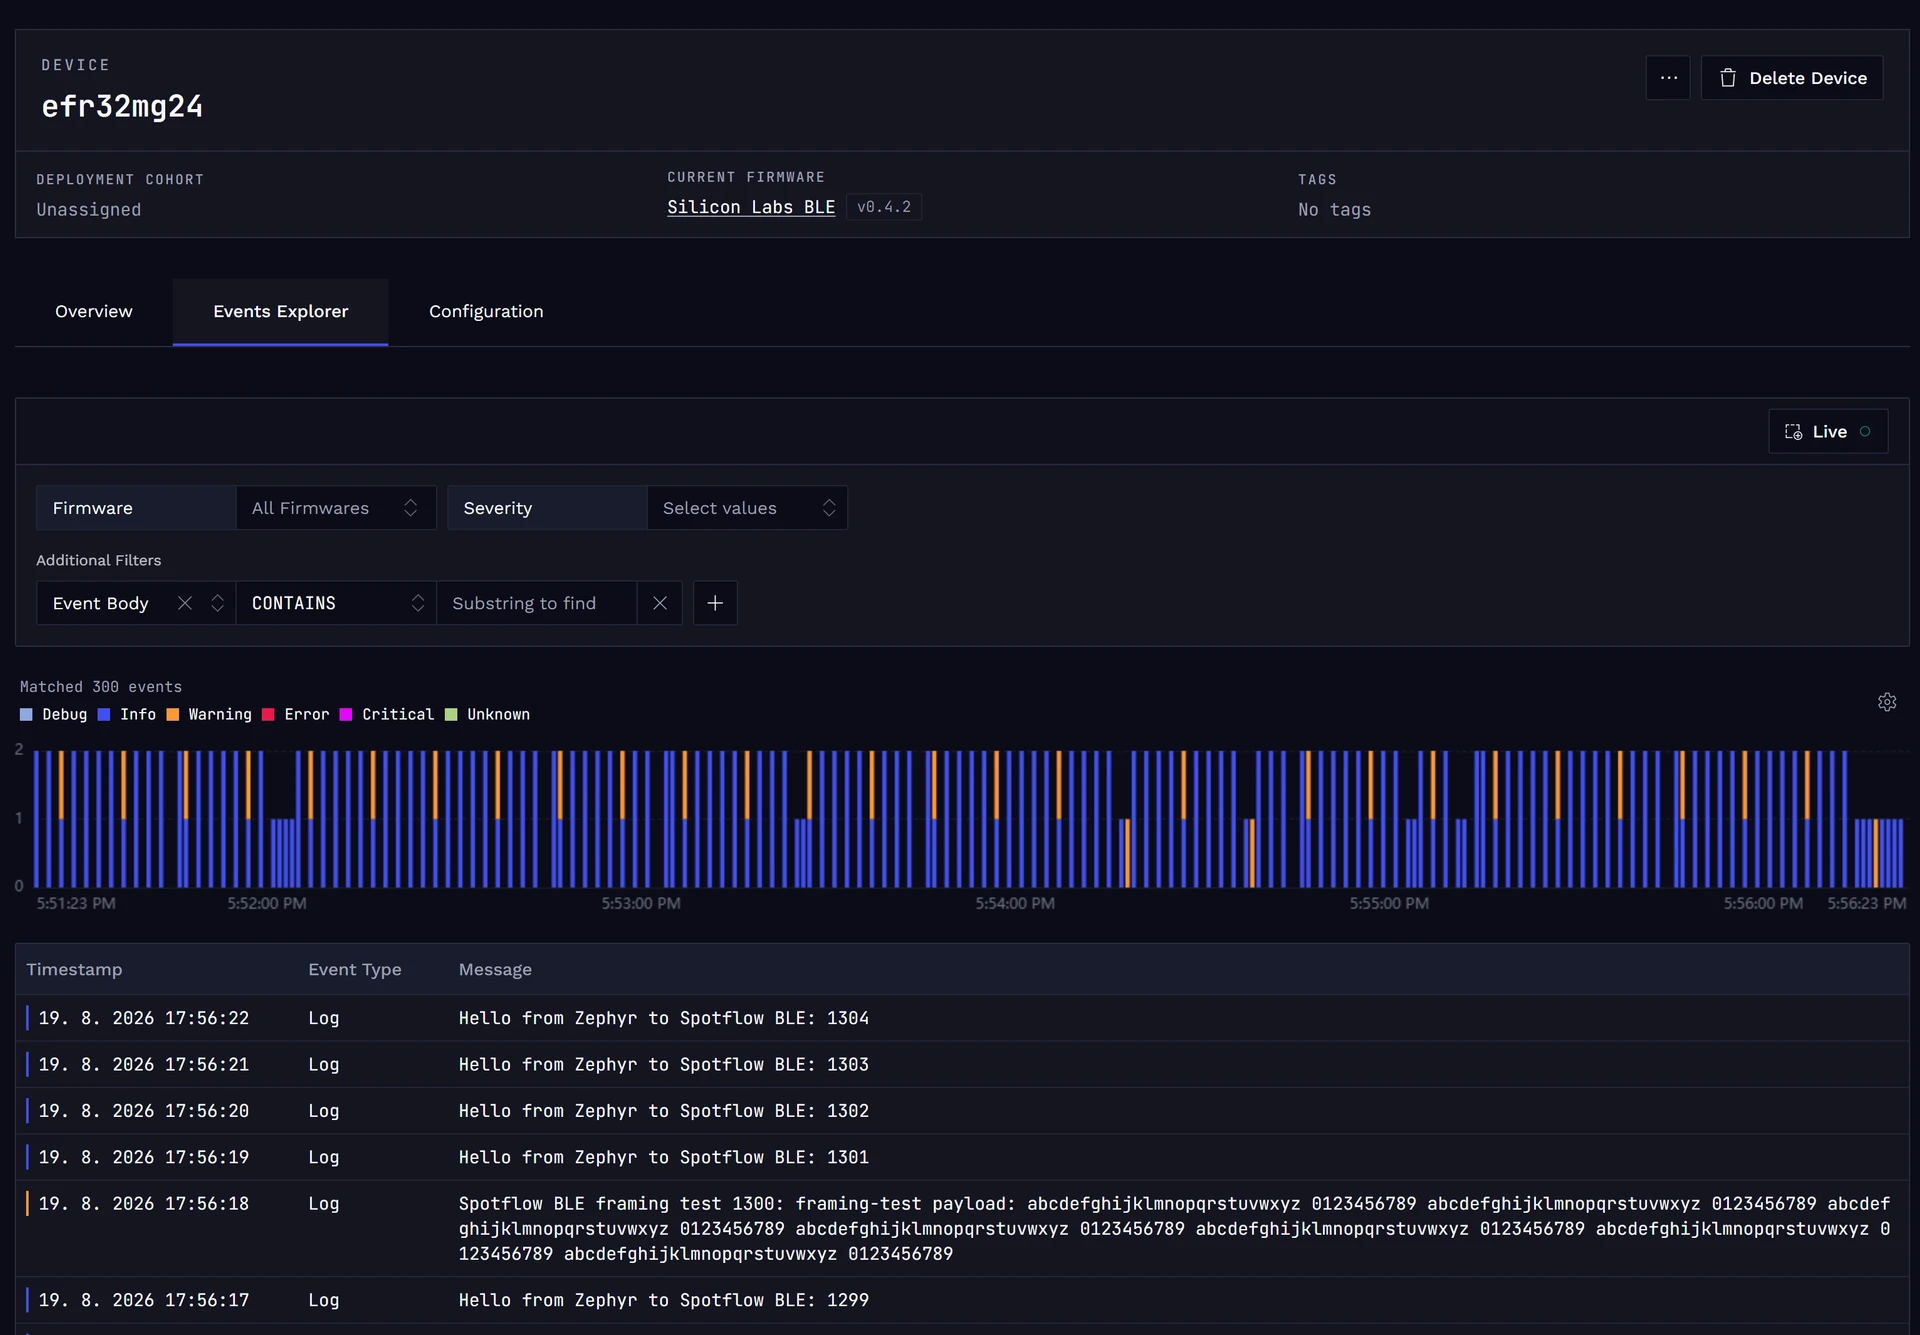
Use the button Open Device Events. You will be forwarded to the device events page in the Spotflow Web App, where you can view logs, metrics, and crash reports from the board.
Verify telemetry and crash reports
The serial console should contain messages similar to:
Starting Spotflow BLE sample
Bluetooth enabled for Spotflow BLE transport
BLE advertising started as ...
Press the board button represented by the Zephyr sw0 devicetree alias to call k_oops(). The board restarts and sends the stored crash report after reconnecting to the gateway.
The board disconnects from the gateway when it restarts. You must reconnect it manually after a crash to forward the crash report to Spotflow.
(Recommended) Upload ELF file with symbols
To unlock advanced crash analysis features, you can upload the ELF file containing debug symbols to Spotflow.
The core dump will be automatically linked based on Build ID embedded into both ELF file and core dump file automatically by Spotflow.
The symbols will be used to decode stack traces and variable names in the Spotflow web application.
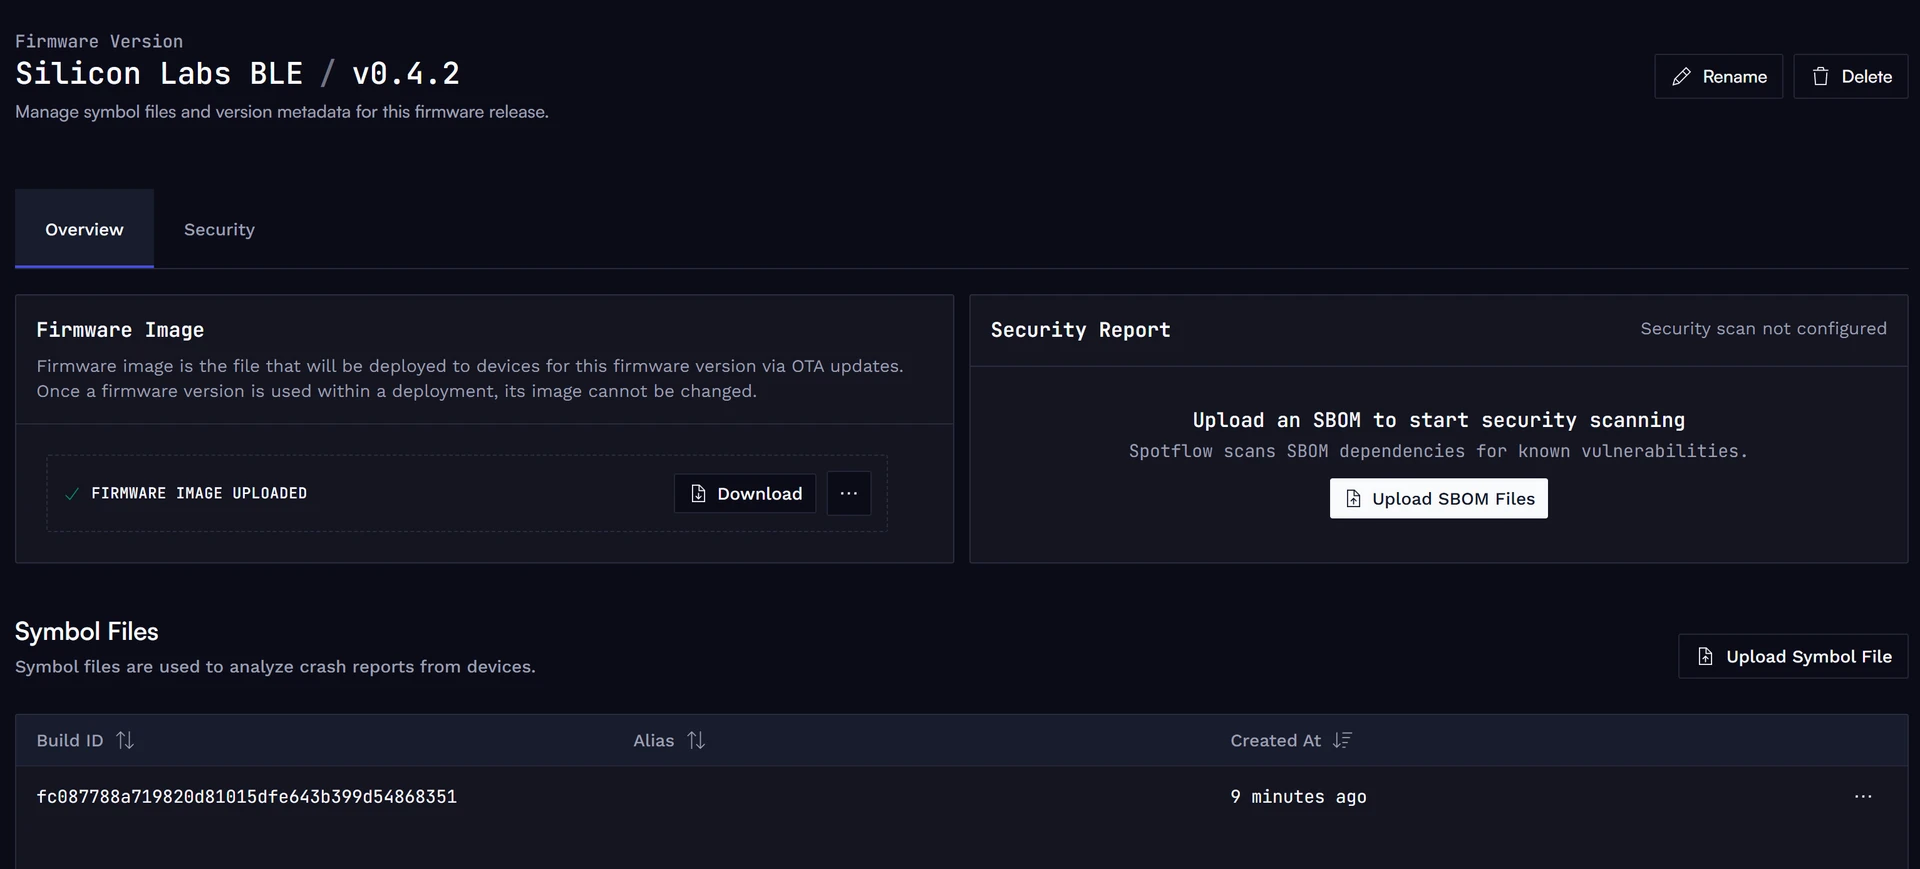
See dedicated Firmware Management page for information about managing firmwares and symbol files.
Analyze Crash Reports in the Web Application
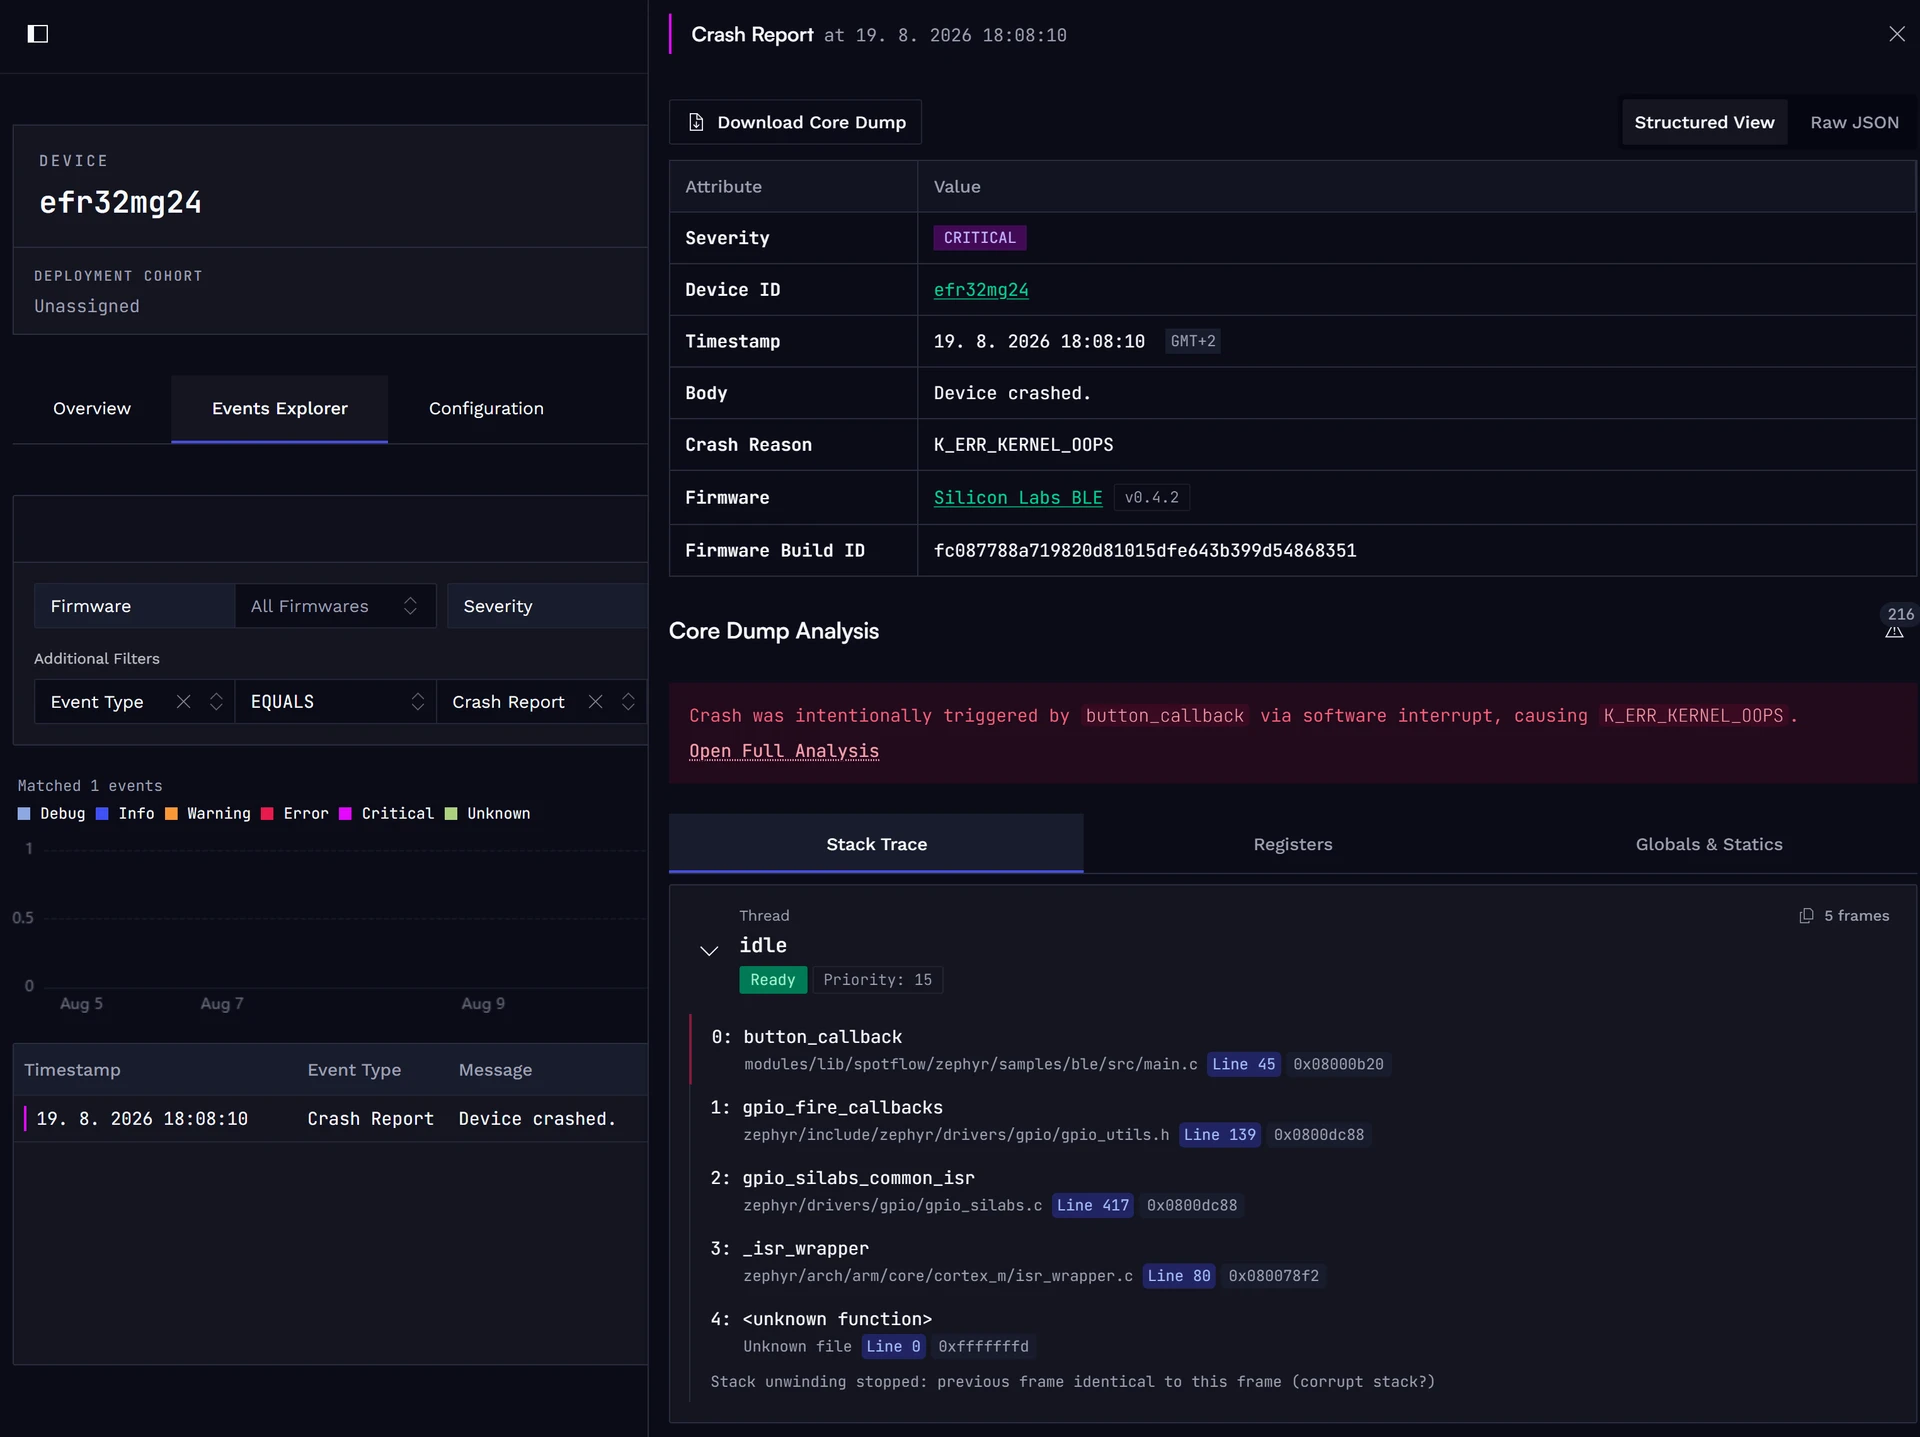
Once your device is integrated, you can analyze crash reports and core dumps in the web application.
You can list the crash reports in the Device Events page, which gives you a comprehensive view of all events collected from your devices. There, you can filter crash reports.
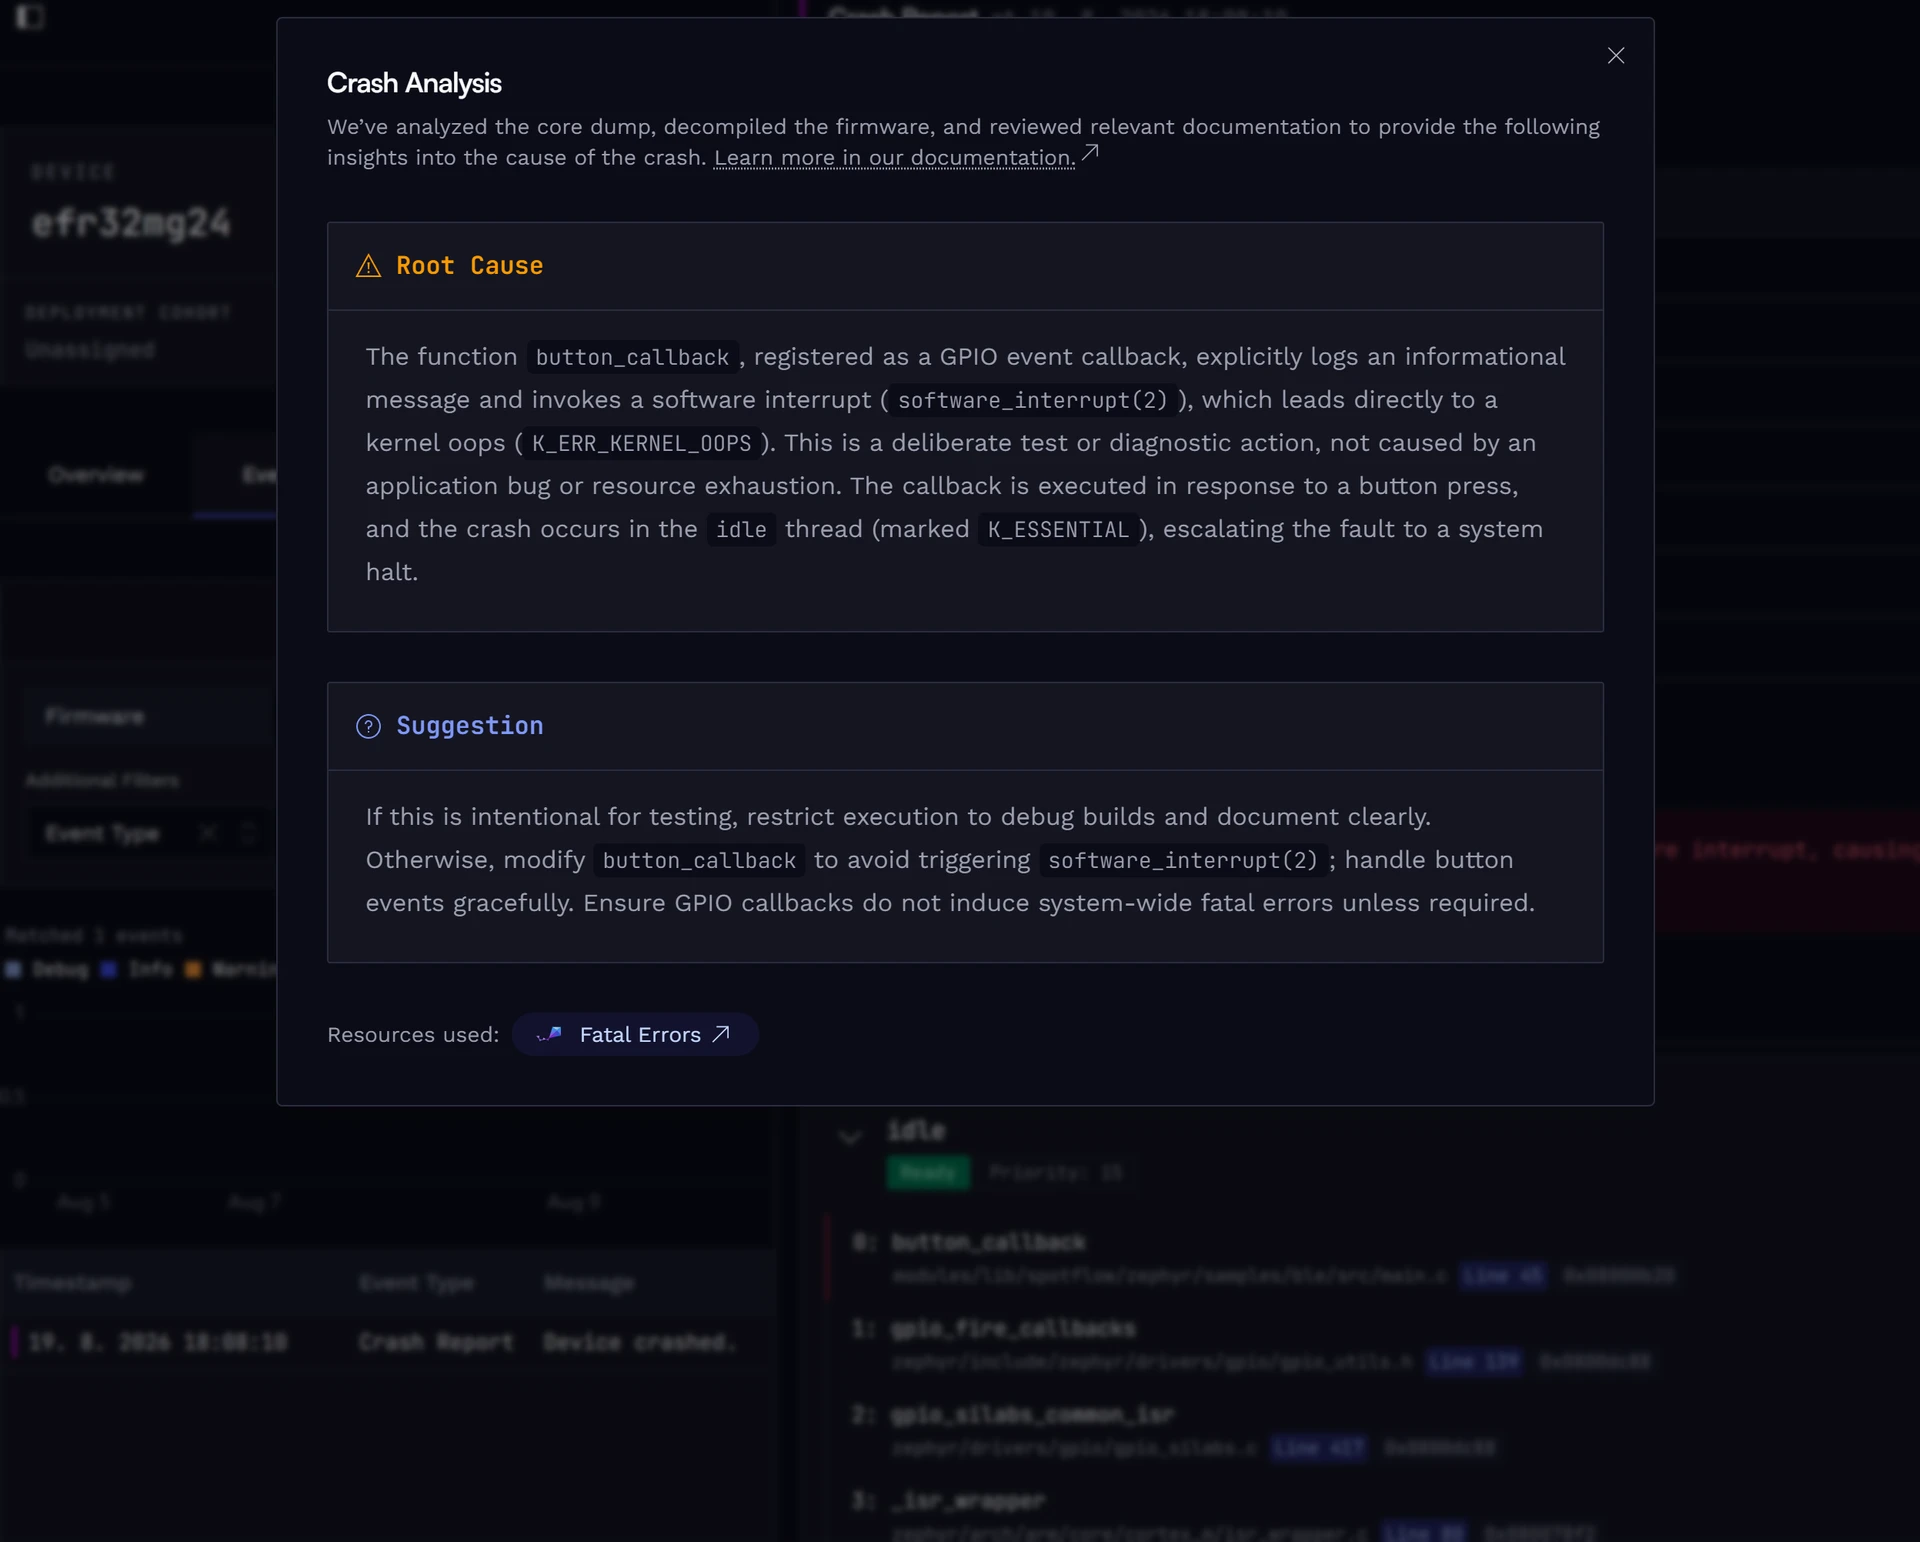
The full analysis includes a detailed description of the root cause and suggestions for fixing the issue. Also, for complete transparency, we include references to all documentation pages used, allowing you to explore further.
Wi-Fi
Use the Spotflow MQTT transport to connect a SiWx917 board directly to Spotflow over Wi-Fi. A BLE gateway is not involved in this workflow.
Install prerequisites
Install the dependencies from the Zephyr Getting Started Guide. You also need a supported SiWx917 board, flashing software supported by the board, and a 2.4 GHz Wi-Fi network with internet access.
Create a West workspace
Run the setup script for the SiWx917 Dev Kit:
source <(curl --proto '=https' --tlsv1.2 -sSf https://downloads.spotflow.io/spotflowup.sh) \
  --zephyr --board siwx917_dk2605a
The script creates a West workspace using the Silicon Labs manifest and installs the required Zephyr SDK and arm-zephyr-eabi toolchain.
Configure Wi-Fi and Spotflow
Open <workspace>/modules/lib/spotflow/zephyr/samples/logs/prj.conf and add:
CONFIG_NET_WIFI_SSID="<your-Wi-Fi-SSID>"
CONFIG_NET_WIFI_PASSWORD="<your-Wi-Fi-password>"

CONFIG_SPOTFLOW_DEVICE_ID="<your-unique-device-id>"
# Ingest key obtained from https://app.spotflow.io/ingest-keys
CONFIG_SPOTFLOW_INGEST_KEY="<your-ingest-key>"
The Device ID must be unique within your Spotflow workspace. Copy an ingest key on the ingest keys page.
The logging sample uses the MQTT transport by default. The sample detects the SiWx91x Wi-Fi interface and enables Wi-Fi automatically.
Build and flash the sample
Run the commands from <workspace>/modules/lib/spotflow/zephyr/samples/logs:
west build --pristine --board siwx917_dk2605a .
west flash
Verify the connection
Open the serial console and confirm that the board connects to the configured Wi-Fi network, obtains an IP address, and establishes an MQTT connection. Expected output includes:
Waiting for network...
Connecting to SSID: ...
Network connectivity established and IP address assigned
MQTT connected!
The sample sends an informational log every two seconds. Open the device in the Spotflow Web App and confirm that the logs arrive.
Analyze Logs in the Web Application
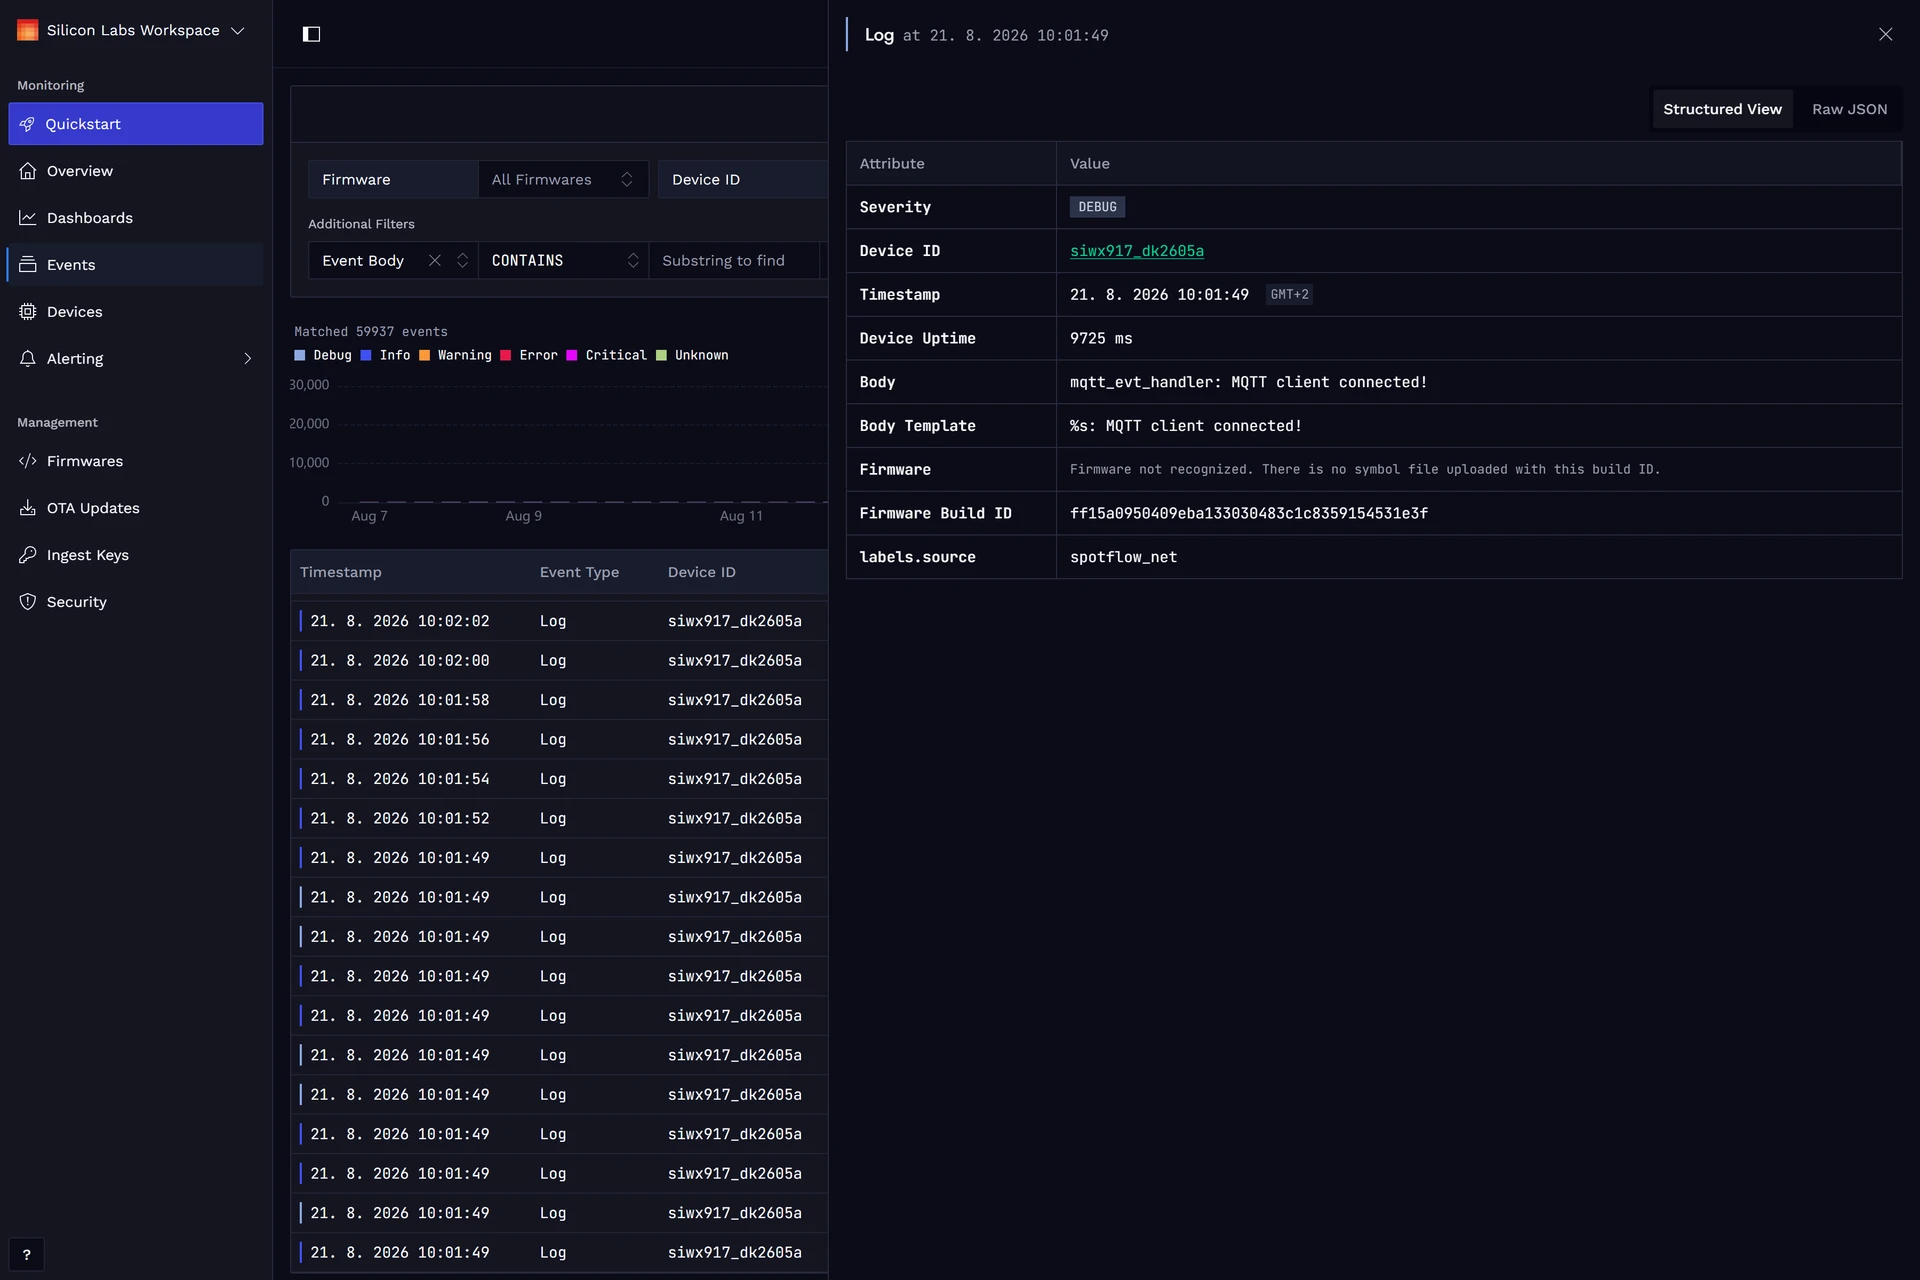
Once your device is integrated and sending logs, you can analyze them in the web application. The main entry point is the Events page, which gives you a comprehensive view of all events collected from your devices. There, you can filter logs by their content, device ID, severity, and other metadata.
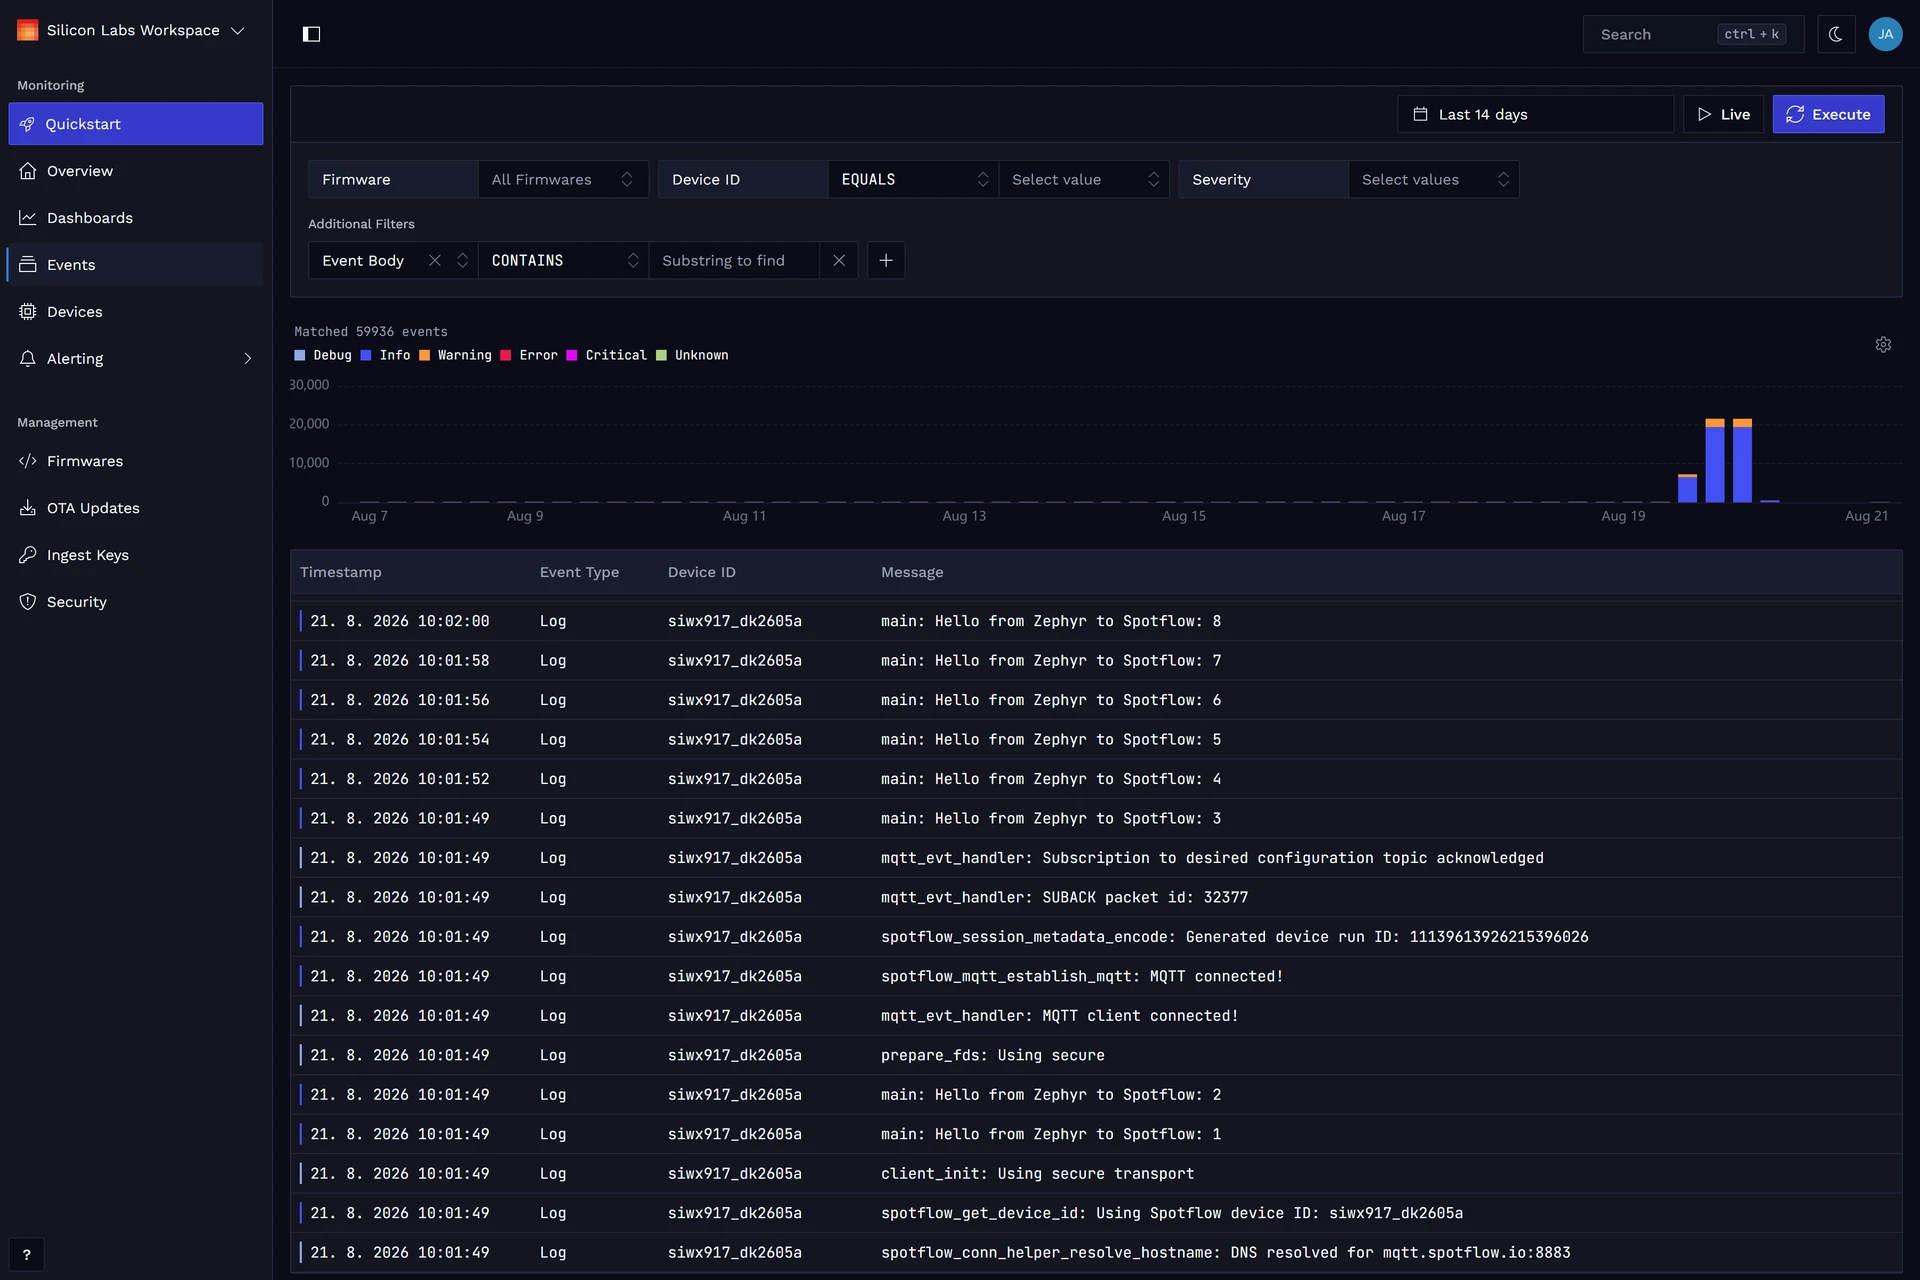
You can click on individual log messages to see their details, and it is possible to drill down into specific events by matching their metadata.
Continue Exploring Spotflow Features
You can continue with other Spotflow features, such as metrics and crash reports. See the Zephyr Crash Reports or Zephyr Metrics guides for more information.