Crash reports with ESP-IDF
Send ESP-IDF core dumps from devices in the field and analyze them with Spotflow.
This guide explains how to collect ESP-IDF core dumps using the Spotflow device module and analyze crash reports in the Spotflow web application.
Prerequisites
Before you start integrating your device with Spotflow, make sure you:
- have development environment with ESP-IDF 5.0+ installed,
- have established a connection to the internet from the device,
- have a Spotflow ingest key.
Alternatively, you can follow the Quickstart: ESP-IDF Integration Guide to integrate Spotflow using sample application, instead of adding the spotflow module to an existing project.
Install Spotflow Device Module
Add the spotflow module as a dependency to your idf_component.yml file.
dependencies:
    spotflow:
        git: https://github.com/spotflow-io/device-sdk.git
        path: esp_idf/spotflow
        version: main
Update Configuration
Enable Spotflow coredump collection, configure device authentication, and tell ESP-IDF to use a custom partition table:
CONFIG_SPOTFLOW_DEVICE_ID="esp-device-001" # Set unique identifier of your device
CONFIG_SPOTFLOW_INGEST_KEY="{your-ingest-key}" # Set your Spotflow ingest key

# Enable Spotflow coredump collection
CONFIG_SPOTFLOW_COREDUMP_BACKEND=y

# Include a build identifier so Spotflow can link crashes to uploaded symbols
CONFIG_SPOTFLOW_USE_BUILD_ID=y

# Use a partition table with a coredump partition
CONFIG_PARTITION_TABLE_CUSTOM=y
CONFIG_PARTITION_TABLE_CUSTOM_FILENAME="partitions.csv"
CONFIG_PARTITION_TABLE_FILENAME="partitions.csv"

# Recommended: avoid slowing down coredump writes and triggering watchdogs
CONFIG_ESP_COREDUMP_LOGS=n
The CONFIG_SPOTFLOW_INGEST_KEY is a secret key that allows your device to authenticate with Spotflow.
You can manage your ingest keys on the ingest keys page.
See details about the Spotflow-specific options later in this doc.
Define Core Dump Flash Partition
ESP-IDF stores the core dump in a dedicated flash partition before Spotflow uploads it after reboot.
Add a coredump data partition to your custom partition table:
# Name,   Type, SubType, Offset,  Size
nvs,      data, nvs,     0x9000,  0x6000
phy_init, data, phy,     0xf000,  0x1000
factory,  app,  factory, 0x10000, 0x150000
coredump, data, coredump,,        256K
If Flash Encryption is enabled on the device, mark the core dump partition as encrypted:
coredump, data, coredump,, 256K, encryptedidf.py coredump-info or idf.py coredump-debug. The Spotflow module reads the core dump on the device after reboot, so ESP-IDF decrypts the partition before the data is uploaded.coredump partition large enough for the ESP-IDF core dump format you configure.Initialize Spotflow
Include spotflow.h and call spotflow_init() after your network connection is established.
On startup, spotflow_init() starts the Spotflow MQTT client and checks whether an ESP-IDF core dump is available for upload.
#include "spotflow.h"

void app_main(void)
{
    // Initialize NVS, networking, Wi-Fi, and connect to the internet first.

    spotflow_init();
}
Upload ELF File with Symbols
To unlock advanced crash analysis features, upload the ELF file containing debug symbols to Spotflow.
The Spotflow ESP-IDF module can include the ESP-IDF application ELF SHA-256 value as the build ID in the uploaded core dump metadata. Spotflow uses that build ID to link the crash report with the matching firmware symbols.
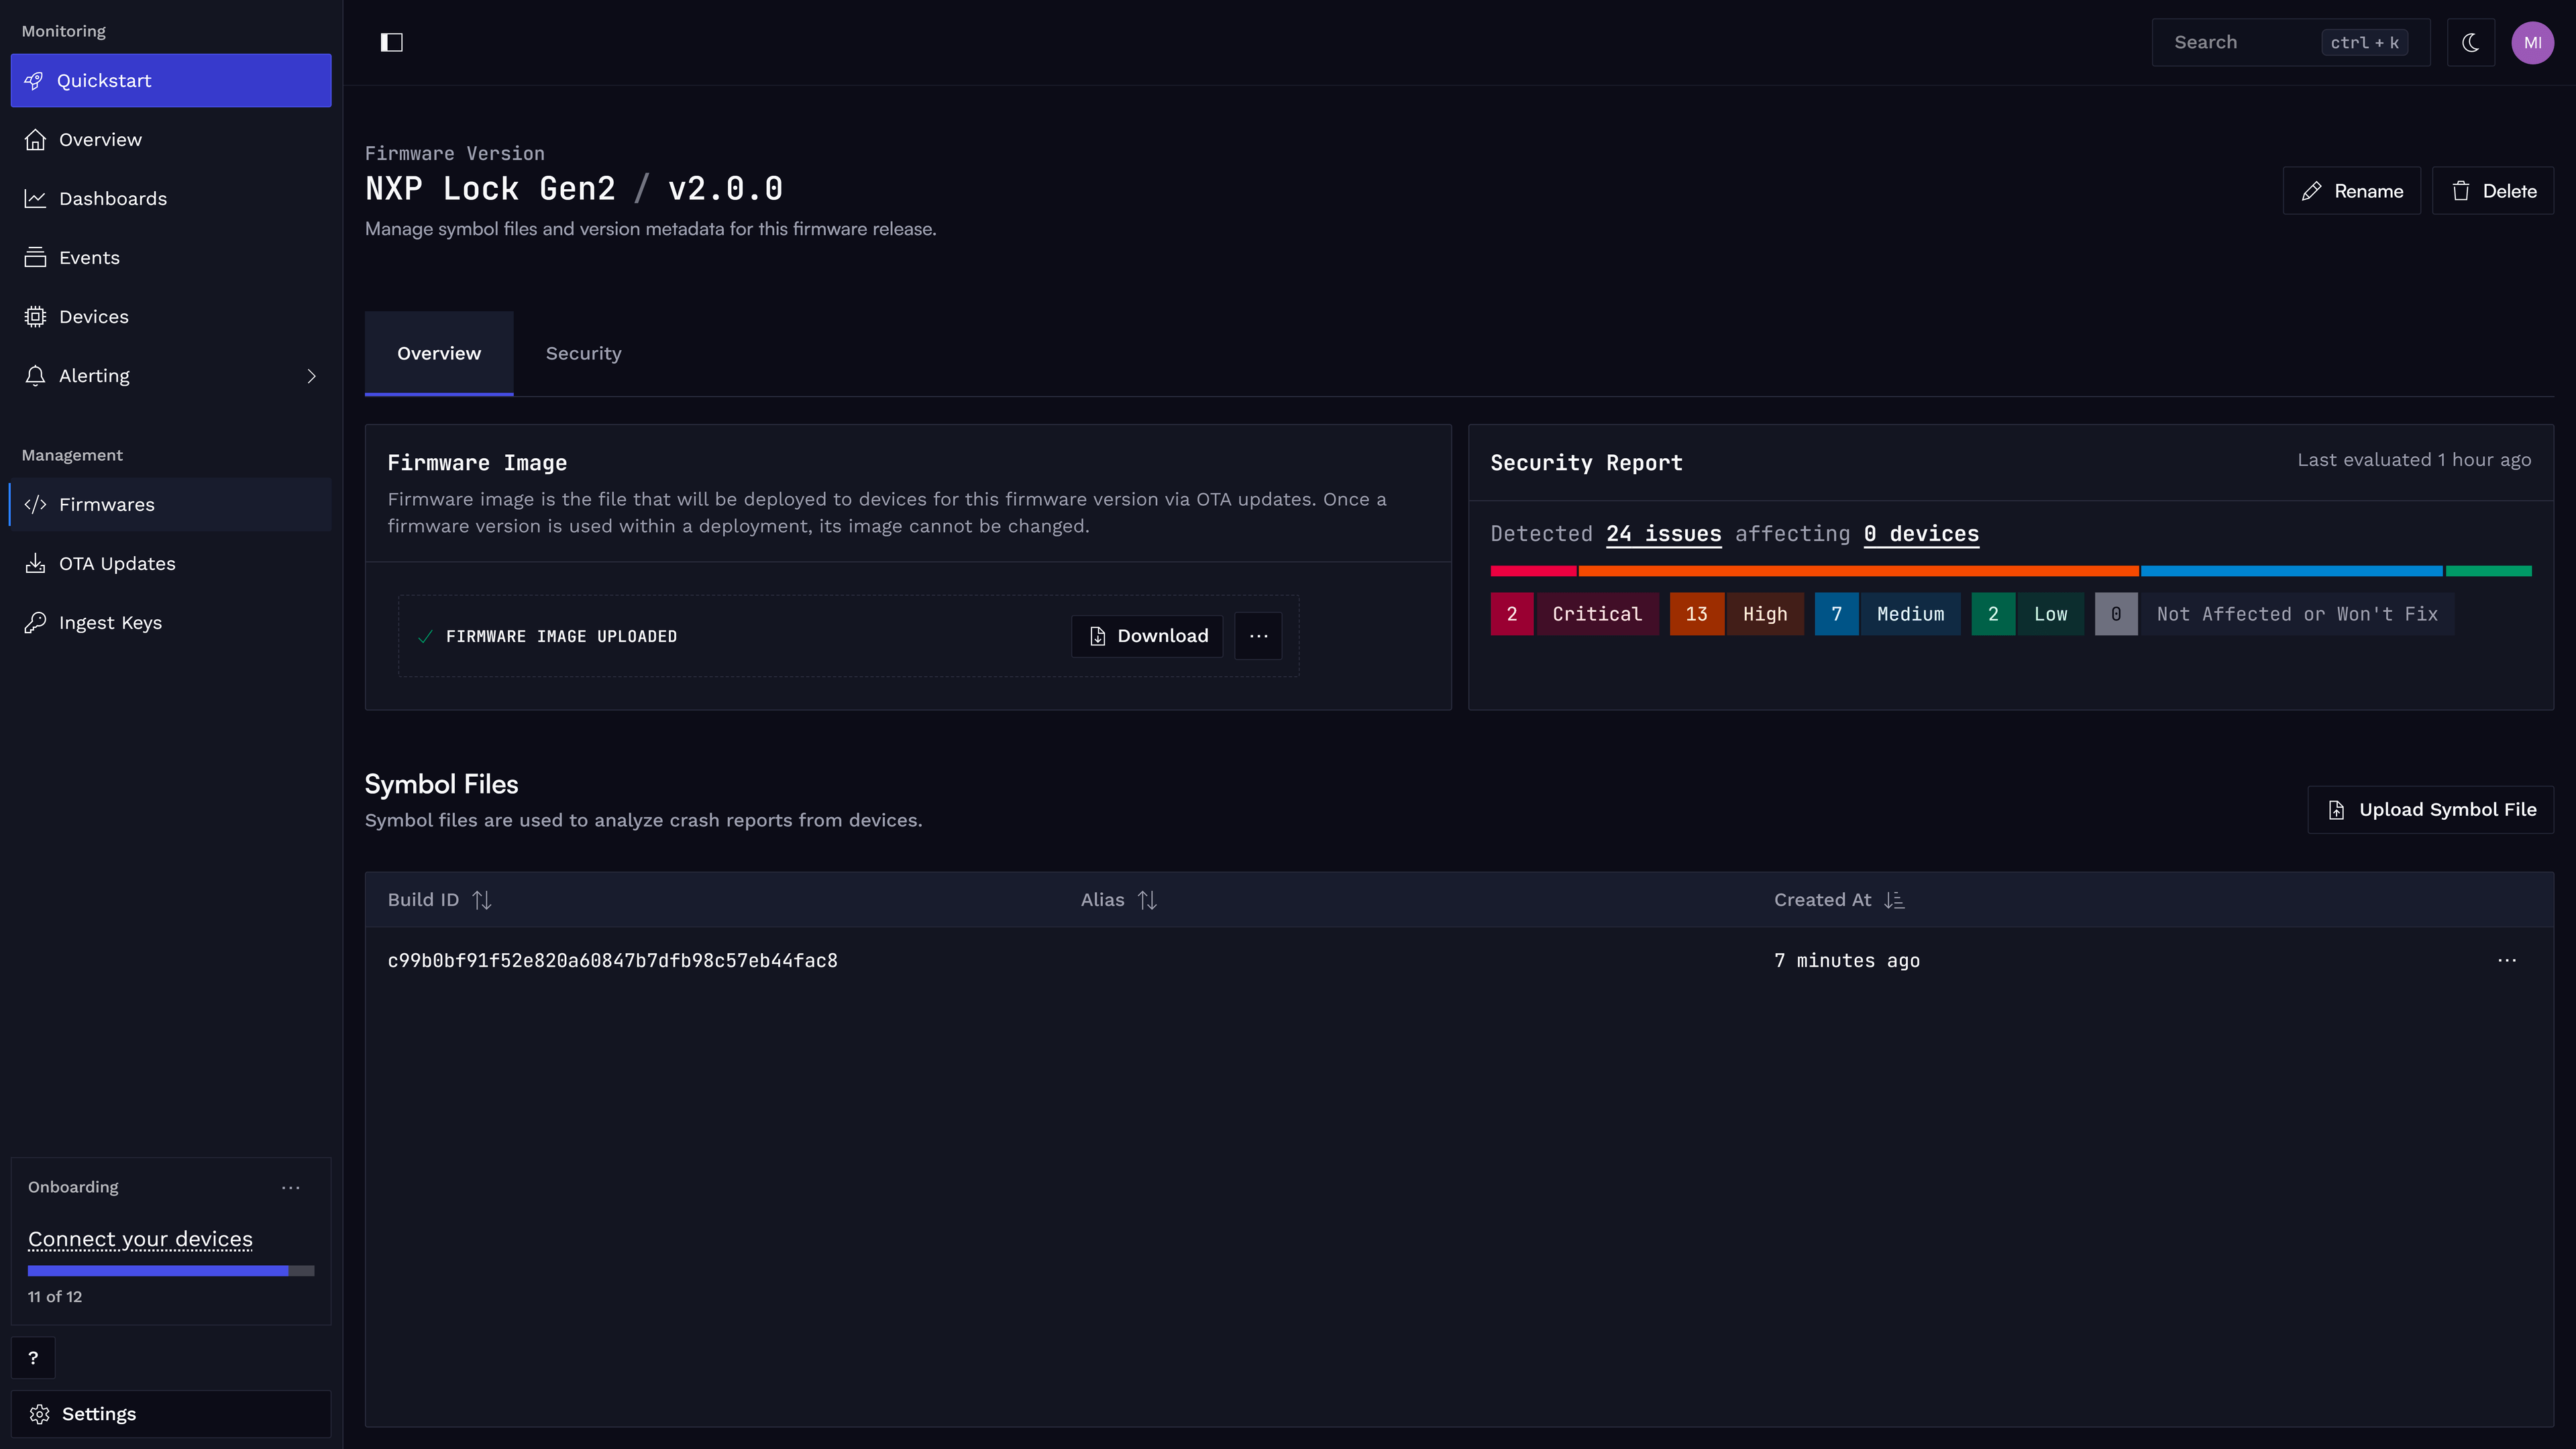
See dedicated Firmware Management page for information about managing firmwares and symbol files.
Wait for or Simulate a Crash
ESP-IDF creates the core dump when a fatal error occurs. After the device reboots and reconnects, Spotflow uploads the stored core dump.
To simulate a crash, call esp_system_abort() from task context:
#include "esp_system.h"

static void simulate_crash(void)
{
    esp_system_abort("Deliberate crash for Spotflow coredump test");
}
The SDK also includes a complete coredump example that triggers a crash from the board's BOOT button.
When testing the coredump example, stop OpenOCD/JTAG debugging and connect to the board through the normal USB serial port. An active debugger can change panic, reset, and reconnect behavior and may prevent the normal crash/coredump flow from being observed.
Press BOOT only after the application has booted and connected; do not press RESET/EN. On ESP32-C6 boards, the example expects the BOOT button on GPIO9. If your board uses a different button GPIO, update the example's GPIO_INPUT_IO_0 definition.
To create a project from the example, run:
idf.py create-project-from-example "spotflow/device_sdk:coredump"Analyze Crash Reports in the Web Application
Once your device is integrated, you can analyze ESP-IDF crash reports and core dumps in the web application.
You can list crash reports on the Events page, filter them by device ID and metadata, and open the detail view for each crash report.

Automatic Analysis
Spotflow automatically processes ESP-IDF core dumps and, when a matching ELF file with symbols is available, links the crash report with the uploaded symbols. The crash report detail can show extracted debugging data.
This includes:
- Stack traces for one or more threads.
- Register values for individual stack frames, including type casting where available.
- Local variables for individual stack frames.
- Global variables captured at the time of the crash.
We also provide raw data extracted from the core dump, so you can dive deeper into the issue if needed.
How the Device Module Works
The Spotflow device module integrates with ESP-IDF's native core dump functionality:
- ESP-IDF writes the core dump to the
coredumpflash partition after a fatal error. - On the next boot,
spotflow_init()checks whether a core dump is present. - If a core dump is found, the module reads its address and size using ESP-IDF APIs.
- The module reads the core dump from flash in chunks controlled by
CONFIG_SPOTFLOW_COREDUMPS_CHUNK_SIZE. - Each chunk is encoded as CBOR and published to Spotflow over MQTT on the
ingest-cbortopic. - Core dump chunks use MQTT QoS 1 and are prioritized over regular log messages.
- After the module has processed the core dump for upload, it erases the stored core dump image.
Build ID and Symbol Linking
To provide the best possible crash analysis experience, Spotflow needs debugging symbols associated with the code that produced the crash.
When CONFIG_SPOTFLOW_USE_BUILD_ID=y, the ESP-IDF module includes a build ID with the uploaded core dump metadata.
For ESP-IDF, the build ID is derived from the running application descriptor's app_elf_sha256 value.
Spotflow uses it to link the uploaded core dump with the matching ELF file uploaded through Firmware Management.
If the build ID is not available, ELF files can still be linked manually to specific core dumps.
Core Dumps vs. Logging
Spotflow core dumps and logging are complementary features. After reboot, core dump upload has priority over buffered log messages so the crash report can be reconstructed as soon as possible.
For local ESP-IDF coredump storage, keep CONFIG_ESP_COREDUMP_LOGS=n unless you have verified that logging during coredump generation does not trigger watchdog timeouts on your target.
Kconfig Options
CONFIG_SPOTFLOW_COREDUMP_BACKEND=ySet SPOTFLOW_COREDUMP_BACKEND to y to enable Spotflow coredump collection.
This also selects ESP-IDF's ELF coredump data format and configures coredumps to be stored in flash.
CONFIG_SPOTFLOW_COREDUMPS_CHUNK_SIZE=2048Use SPOTFLOW_COREDUMPS_CHUNK_SIZE to set the size of each core dump chunk uploaded to Spotflow.
Larger chunks reduce upload overhead but require more RAM for preparing and sending each MQTT message.
CONFIG_SPOTFLOW_MAX_QUEUE_SIZE=2Use SPOTFLOW_MAX_QUEUE_SIZE to set how many core dump chunks can be queued before sending.
Approximate queue memory usage is CONFIG_SPOTFLOW_MAX_QUEUE_SIZE * CONFIG_SPOTFLOW_COREDUMPS_CHUNK_SIZE, plus encoding overhead.
CONFIG_SPOTFLOW_USE_BUILD_ID=ySet SPOTFLOW_USE_BUILD_ID to y to include the ESP-IDF application build ID in the first uploaded core dump chunk.
This enables automatic linking between crash reports and uploaded ELF symbols.
CONFIG_ESP_COREDUMP_LOGS=nWe recommend disabling ESP-IDF coredump logs because they can increase the time needed to store the core dump to flash. On some targets, that can trigger the watchdog timer and make the core dump unusable.
See KConfig for core dumps for details about the Spotflow ESP-IDF coredump options.
Learn More
Fundamentals: Crash reports & core dumps
Fundamentals: Firmware management
Guide: Logging with ESP-IDF
How is this guide?